Full Report
Figures converted from IDR to USD at historical FX rates (frankfurter.app). Monetary statements are shown in US$ millions; per-share figures use the matching period rate. Filing links open the native figures from which each USD value was derived.
The numbers behind PT Paramita Bangun Sarana Tbk: as-reported financial statements and company metrics for FY2021–FY2025, traced to the source filings, opened with the share-price history those statements have to justify. Every linked USD figure opens the exact filing row containing the native reported value from which it was converted. Amounts in US$ millions unless noted.
Reading notes: Rendered from standardized data feeds only — the statement extractor did not produce a verified extraction this run, so figures carry no page links.
Share Price — Available History Since January 2026
The stock closed at $0.04 on Jul 24, 2026 — down 69% over the window shown, trading between $0.03 and $0.14. At that close the stock trades at 6.8× FY2025 diluted EPS as reported below.
Source: market price feed, daily closes, Jan 2026–Jul 2026 — the feed marks this available history as partial. Price return only, excludes dividends. Prices converted from IDR to USD with date-matched or nearest-available FX.
FY2025 at a Glance
Revenue (US$ millions)
Operating income (US$ millions)
Net income (US$ millions)
Diluted EPS
Source: standardized company data feed — these figures carry no page links.
Income Statement
| Income Statement | FY2021 | FY2022 | FY2023 | FY2024 | FY2025 |
|---|---|---|---|---|---|
| Total revenue | 20 | 48 | 37 | 72 | 95 |
| Operating income | 6 | 10 | 7 | 12 | 15 |
| Pre-tax income | 6 | 10 | 16 | 15 | 22 |
| Net income | 6 | 9 | 13 | 13 | 19 |
| Diluted EPS | 0.00 | 0.00 | 0.00 | 0.00 | 0.01 |
| Total revenue growth, derived | — | +143.4% | -21.7% | +92.2% | +33.4% |
Source: standardized company data feed — these figures carry no page links.
Balance Sheet
| Balance Sheet | FY2021 | FY2022 | FY2023 | FY2024 | FY2025 |
|---|---|---|---|---|---|
| Cash and equivalents | 11 | 12 | 11 | 5 | 9 |
| Total assets | 54 | 56 | 52 | 69 | 85 |
| Total liabilities | 14 | 14 | 13 | 21 | 30 |
Source: standardized company data feed — these figures carry no page links.
Cash Flow
| Cash Flow | FY2021 | FY2022 | FY2023 | FY2024 | FY2025 |
|---|---|---|---|---|---|
| Operating cash flow | 3 | 13 | 13 | (3) | 22 |
| Capital expenditure | 2 | 2 | 3 | 2 | 1 |
| Free cash flow | 1 | 11 | 10 | (4) | 21 |
Source: standardized company data feed — these figures carry no page links.
Profitability and Returns (as reported)
| Profitability and Returns (as reported) | FY2021 | FY2022 | FY2023 | FY2024 | FY2025 |
|---|---|---|---|---|---|
| Return on assets (profit / total assets) | 10.7% | 15.6% | 24.2% | 19.2% | 22.5% |
| Return on equity (profit / equity) | 14.3% | 20.8% | 32.3% | 27.7% | 34.5% |
| Net profit margin (profit / revenues) | 29.9% | 18.3% | 33.6% | 18.6% | 20.1% |
Source: company filings [1] [2]. Click any linked figure to open the filing page with the row highlighted.
Liquidity and Leverage (as reported)
| Liquidity and Leverage (as reported) | FY2021 | FY2022 | FY2023 | FY2024 | FY2025 |
|---|---|---|---|---|---|
| Current ratio | 3.3 | 3.2 | 3.1 | 2.7 | 2.5 |
| Debt-to-equity ratio (DER) | 33.7% | 32.9% | 33.2% | 44.0% | 53.0% |
| Debt-to-asset ratio (DAR) | 25.2% | 24.8% | 24.9% | 30.6% | 34.6% |
Source: company filings [1] [2]. Click any linked figure to open the filing page with the row highlighted.
Workforce
| Workforce | FY2021 | FY2022 | FY2023 | FY2024 | FY2025 |
|---|---|---|---|---|---|
| Total employees (period-end) | 200 | 296 | 298 | 504 | 711 |
| Permanent employees | 103 | 99 | 115 | 115 | 128 |
| Contract employees | 97 | 197 | 183 | 389 | 583 |
Source: company filings [3] [4]. Click any linked figure to open the filing page with the row highlighted.
Dividends and Payout
| Dividends and Payout | FY2021 | FY2022 | FY2023 | FY2024 | FY2025 |
|---|---|---|---|---|---|
| Dividend per share (from the year's profit) | — | 0.00 | 0.00 | 0.00 | 0.00 |
| Dividend payout ratio (of the year's profit) | 84.6% | 89.6% | 82.5% | 76.7% | 56.0% |
| Cash dividend declared (from the year's profit) | 4,935,000 | 7,800,000 | 10,335,000 | 10,230,000 | — |
Source: company filings [5] [6] [7] [8]. Click any linked figure to open the filing page with the row highlighted.
Customer Concentration
| Customer Concentration | FY2021 | FY2022 | FY2023 | FY2024 | FY2025 |
|---|---|---|---|---|---|
| Customers each contributing over 10% of revenue | 1 | 3 | 2 | 5 | 5 |
| Largest customer - share of revenue | 43.9% | 54.9% | 42.6% | 33.8% | — |
| Largest customer - revenue | 8,576,928 | 26,118,907 | 15,874,871 | 24,219,913 | — |
| Customers over 10% - combined share of revenue | 43.9% | 85.9% | 74.3% | 84.8% | — |
Source: company filings [9] [10] [11] [12]. Click any linked figure to open the filing page with the row highlighted.
Long-Term Record
| Fiscal year | Total revenue | Operating income | Net income | Diluted EPS |
|---|---|---|---|---|
| FY2016 | 94 | 11 | 9 | 0.01 |
| FY2017 | 47 | 8 | 7 | 0.00 |
| FY2018 | 25 | 2 | 3 | 0.00 |
| FY2019 | 44 | 2 | 1 | 0.00 |
| FY2020 | 39 | 4 | 3 | 0.00 |
| FY2021 | 20 | 6 | 6 | 0.00 |
| FY2022 | 48 | 10 | 9 | 0.00 |
| FY2023 | 37 | 7 | 13 | 0.00 |
| FY2024 | 72 | 12 | 13 | 0.00 |
| FY2025 | 95 | 15 | 19 | 0.01 |
Source: standardized company data feed — these figures carry no page links.
Analyst Consensus
Street ratings: No sell-side analyst coverage. PBSA (PT Paramita Bangun Sarana Tbk, IDX/PBSA.JK) is a small-cap Indonesian construction company with 0 covering analysts per Simply Wall St, and no consensus price target or buy/hold/sell rating on Yahoo Finance or stockanalysis.com. No mean analyst price target exists (0 is a placeholder for 'not available'). Only quantitative/model fair-value estimates are published (e.g., Simply Wall St model fair value ~IDR 331.5), which are not sell-side ratings.
Estimate source: analyst consensus (claude_web), as of 2026-07-24. Forecasts carry no filing page links.
Traceability
75 of 170 figures on this page (44%) link to the filing page containing the native reported figure from which the USD value was converted — click a linked figure to open that source row. Unlinked figures come from standardized data feeds or pre-filing years.
- Rendered from standardized data feeds only — the statement extractor did not produce a verified extraction this run, so figures carry no page links.
PT Paramita Bangun Sarana Tbk's management explains the business in its own materials. The slides below do the most of that work, pulled from the documents preserved in Sources. Each source link opens the complete presentation at that slide in a new tab.
Annual Report 2025 — FY2025
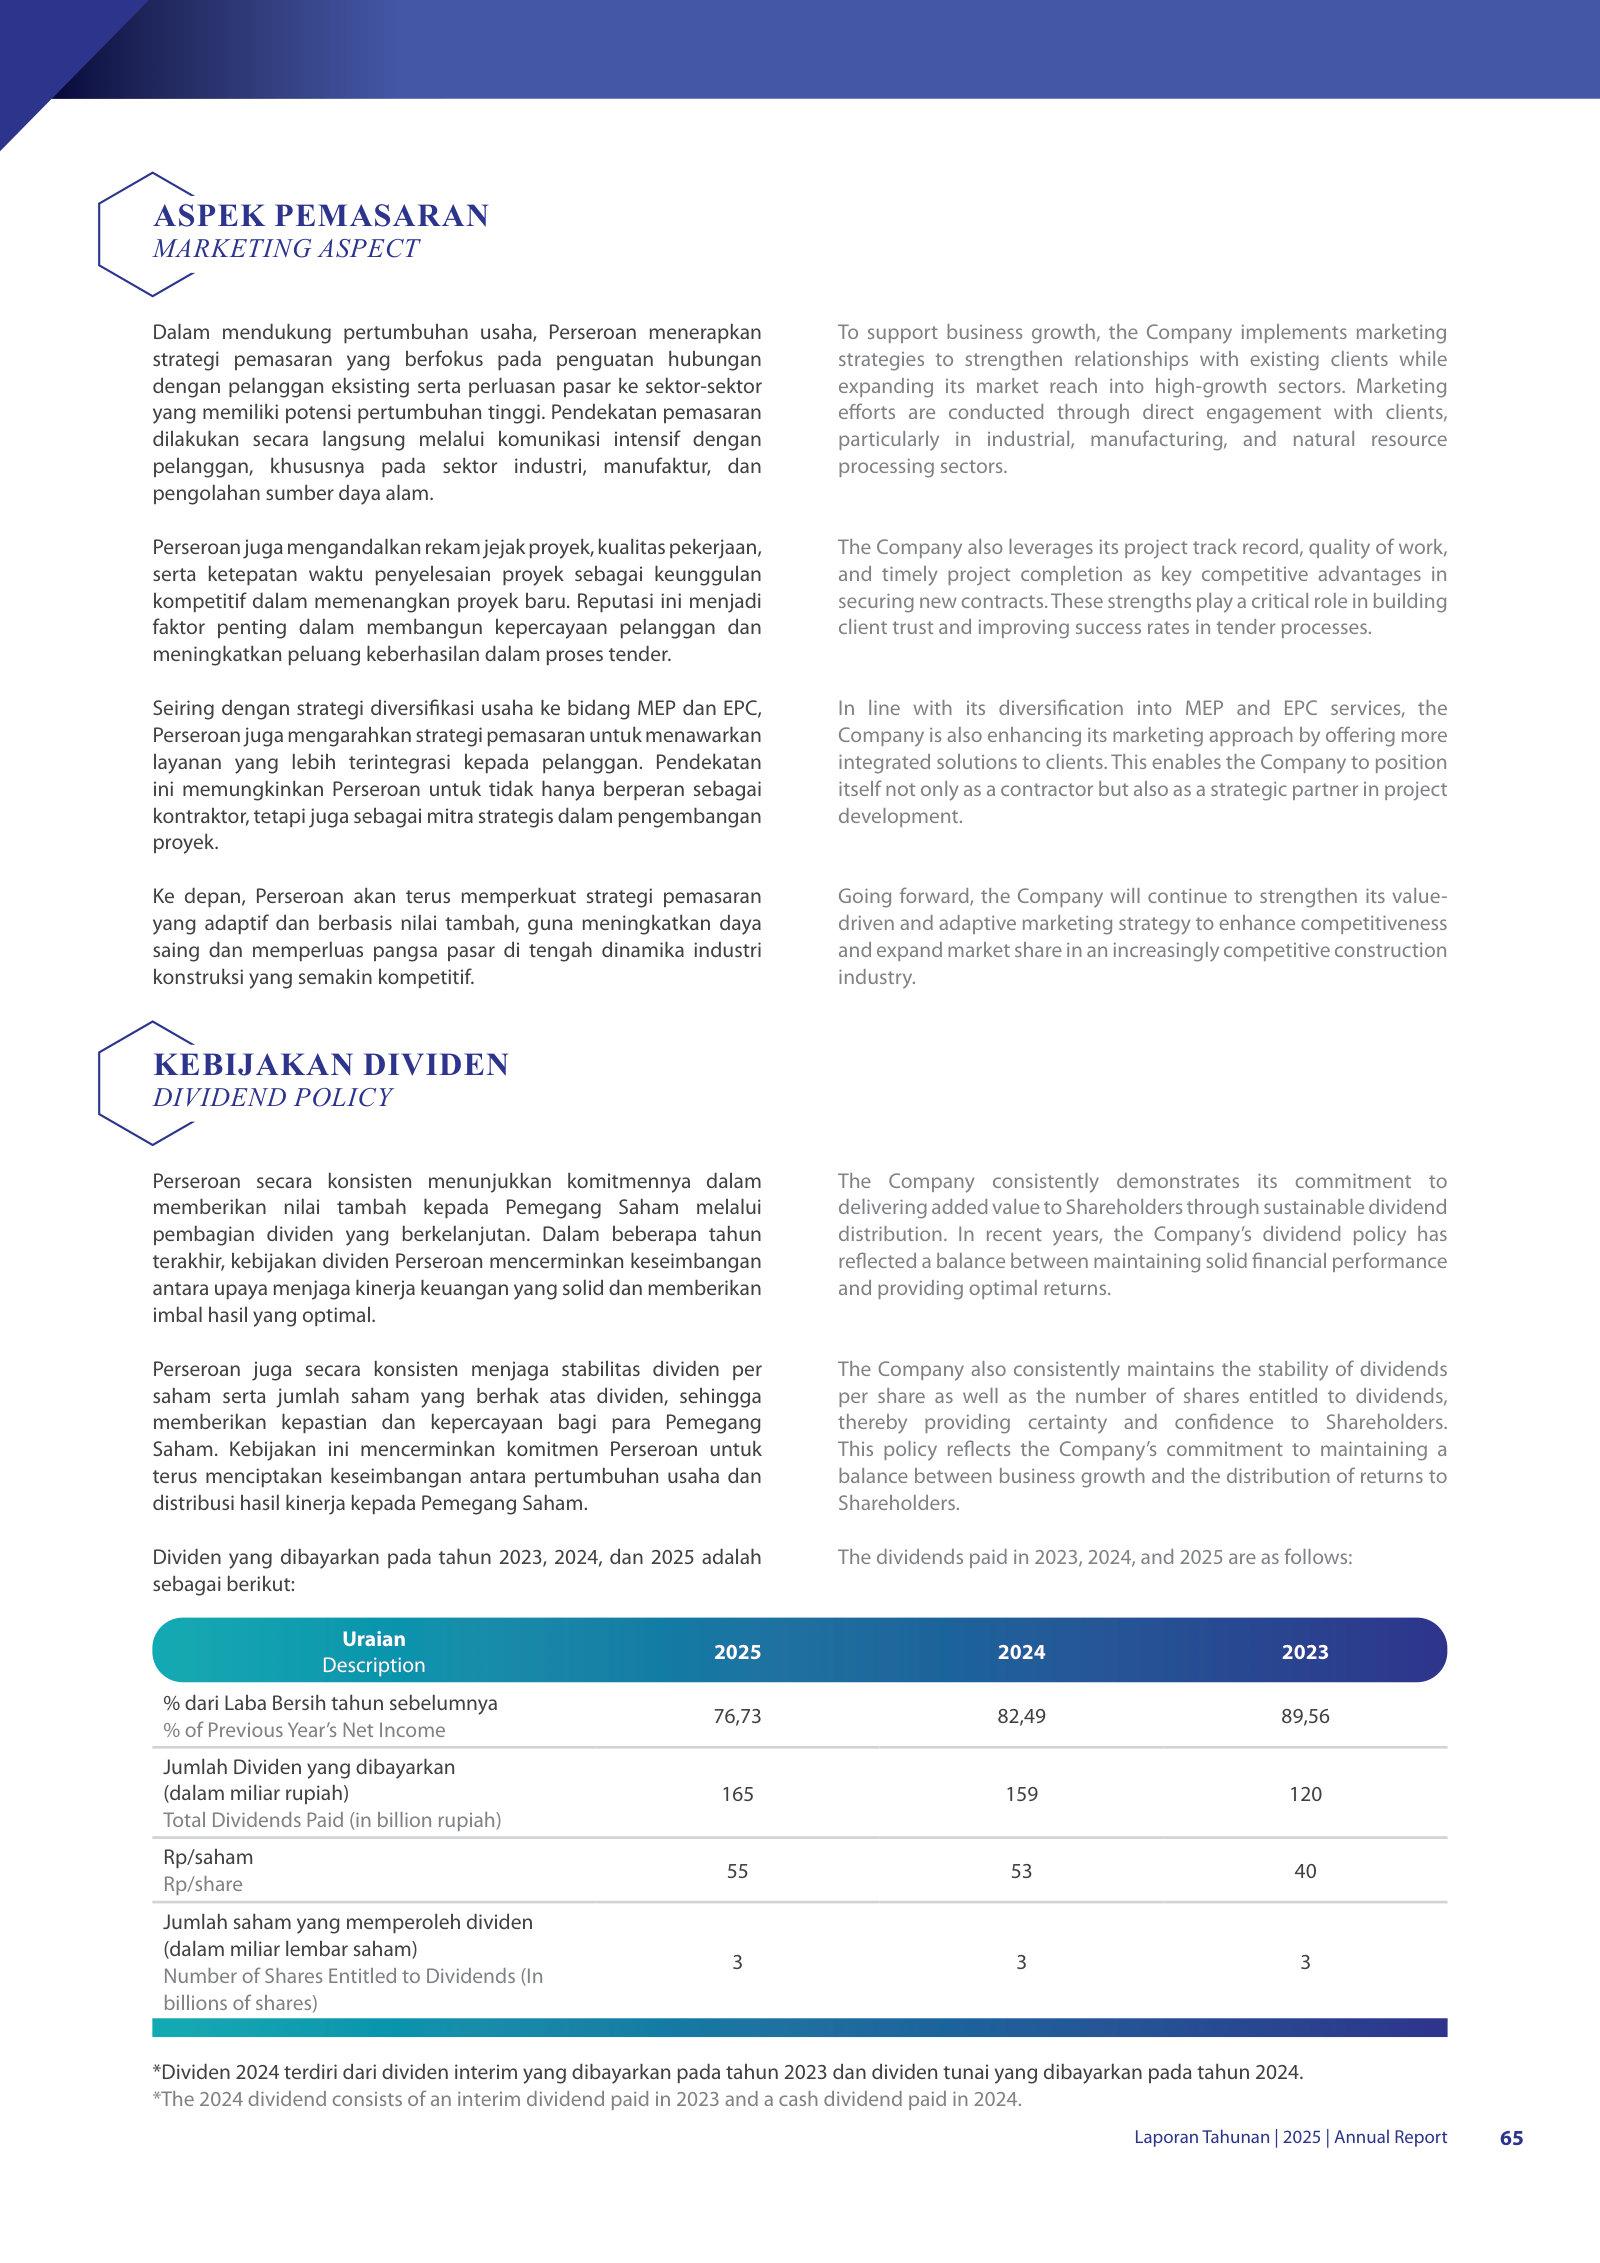
PBSA publishes no investor deck; this annual report is its fullest self-description — what it builds, where, its revenue mix, ownership, targets and dividends. · Open the full document →
More from management
Annual Report 2024 — FY2024 · 303 pages · The prior-year edition — same company-profile visuals plus the 2024 figures that are the base for 2025's growth. · Open →
Q1 FY2026 Results — Q1 FY2026 · 110 pages · The most recent quarterly numbers — interim financial statements, not an explanatory deck. · Open →
IPO Prospectus (2016) — 2016 IPO · 192 pages · The listing prospectus — founding-era business description, client concentration and the risk factors laid out at IPO. · Open →
PT Paramita Bangun Sarana Tbk's annual reports contain management's most considered account of the business. These are the sections, passages and visual pages worth opening in the originals preserved in Sources.
PT Paramita Bangun Sarana Tbk — FY2025 Annual Report — FY2025
The latest and most complete account of the business — record FY2025 results, the palm-oil-refinery demand engine, and the segment economics that sit beneath the headline growth. · Open the full document →
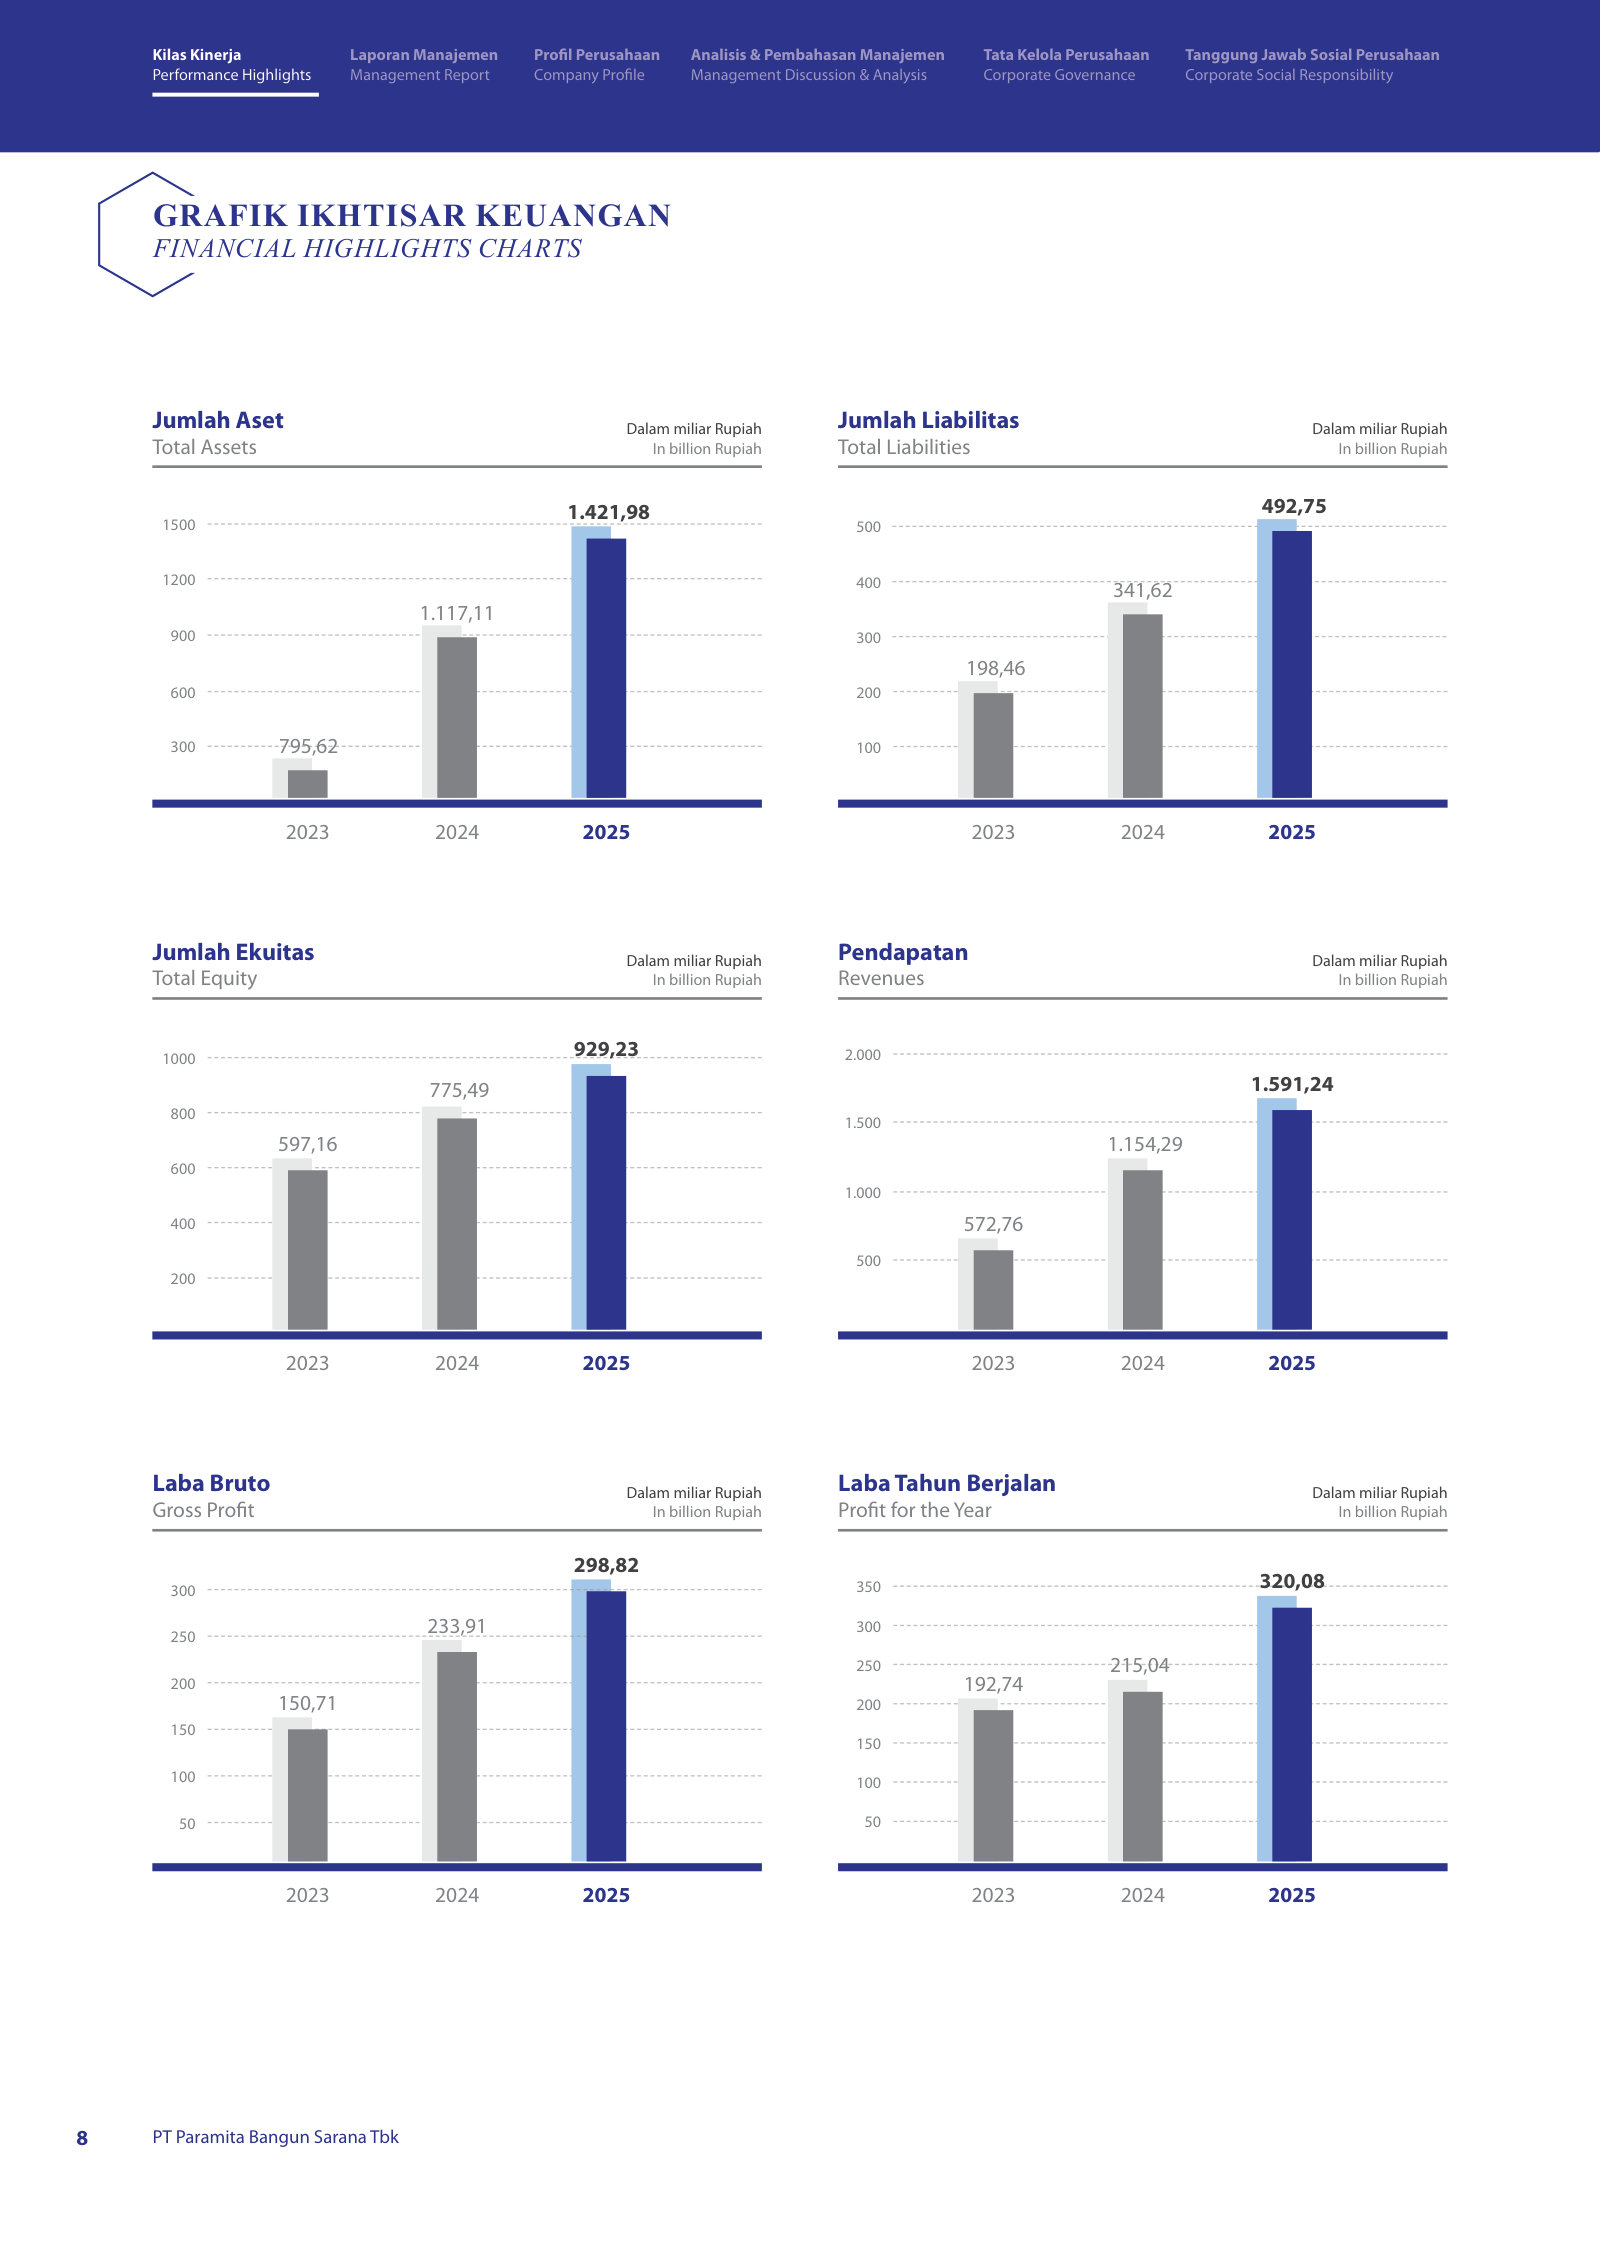
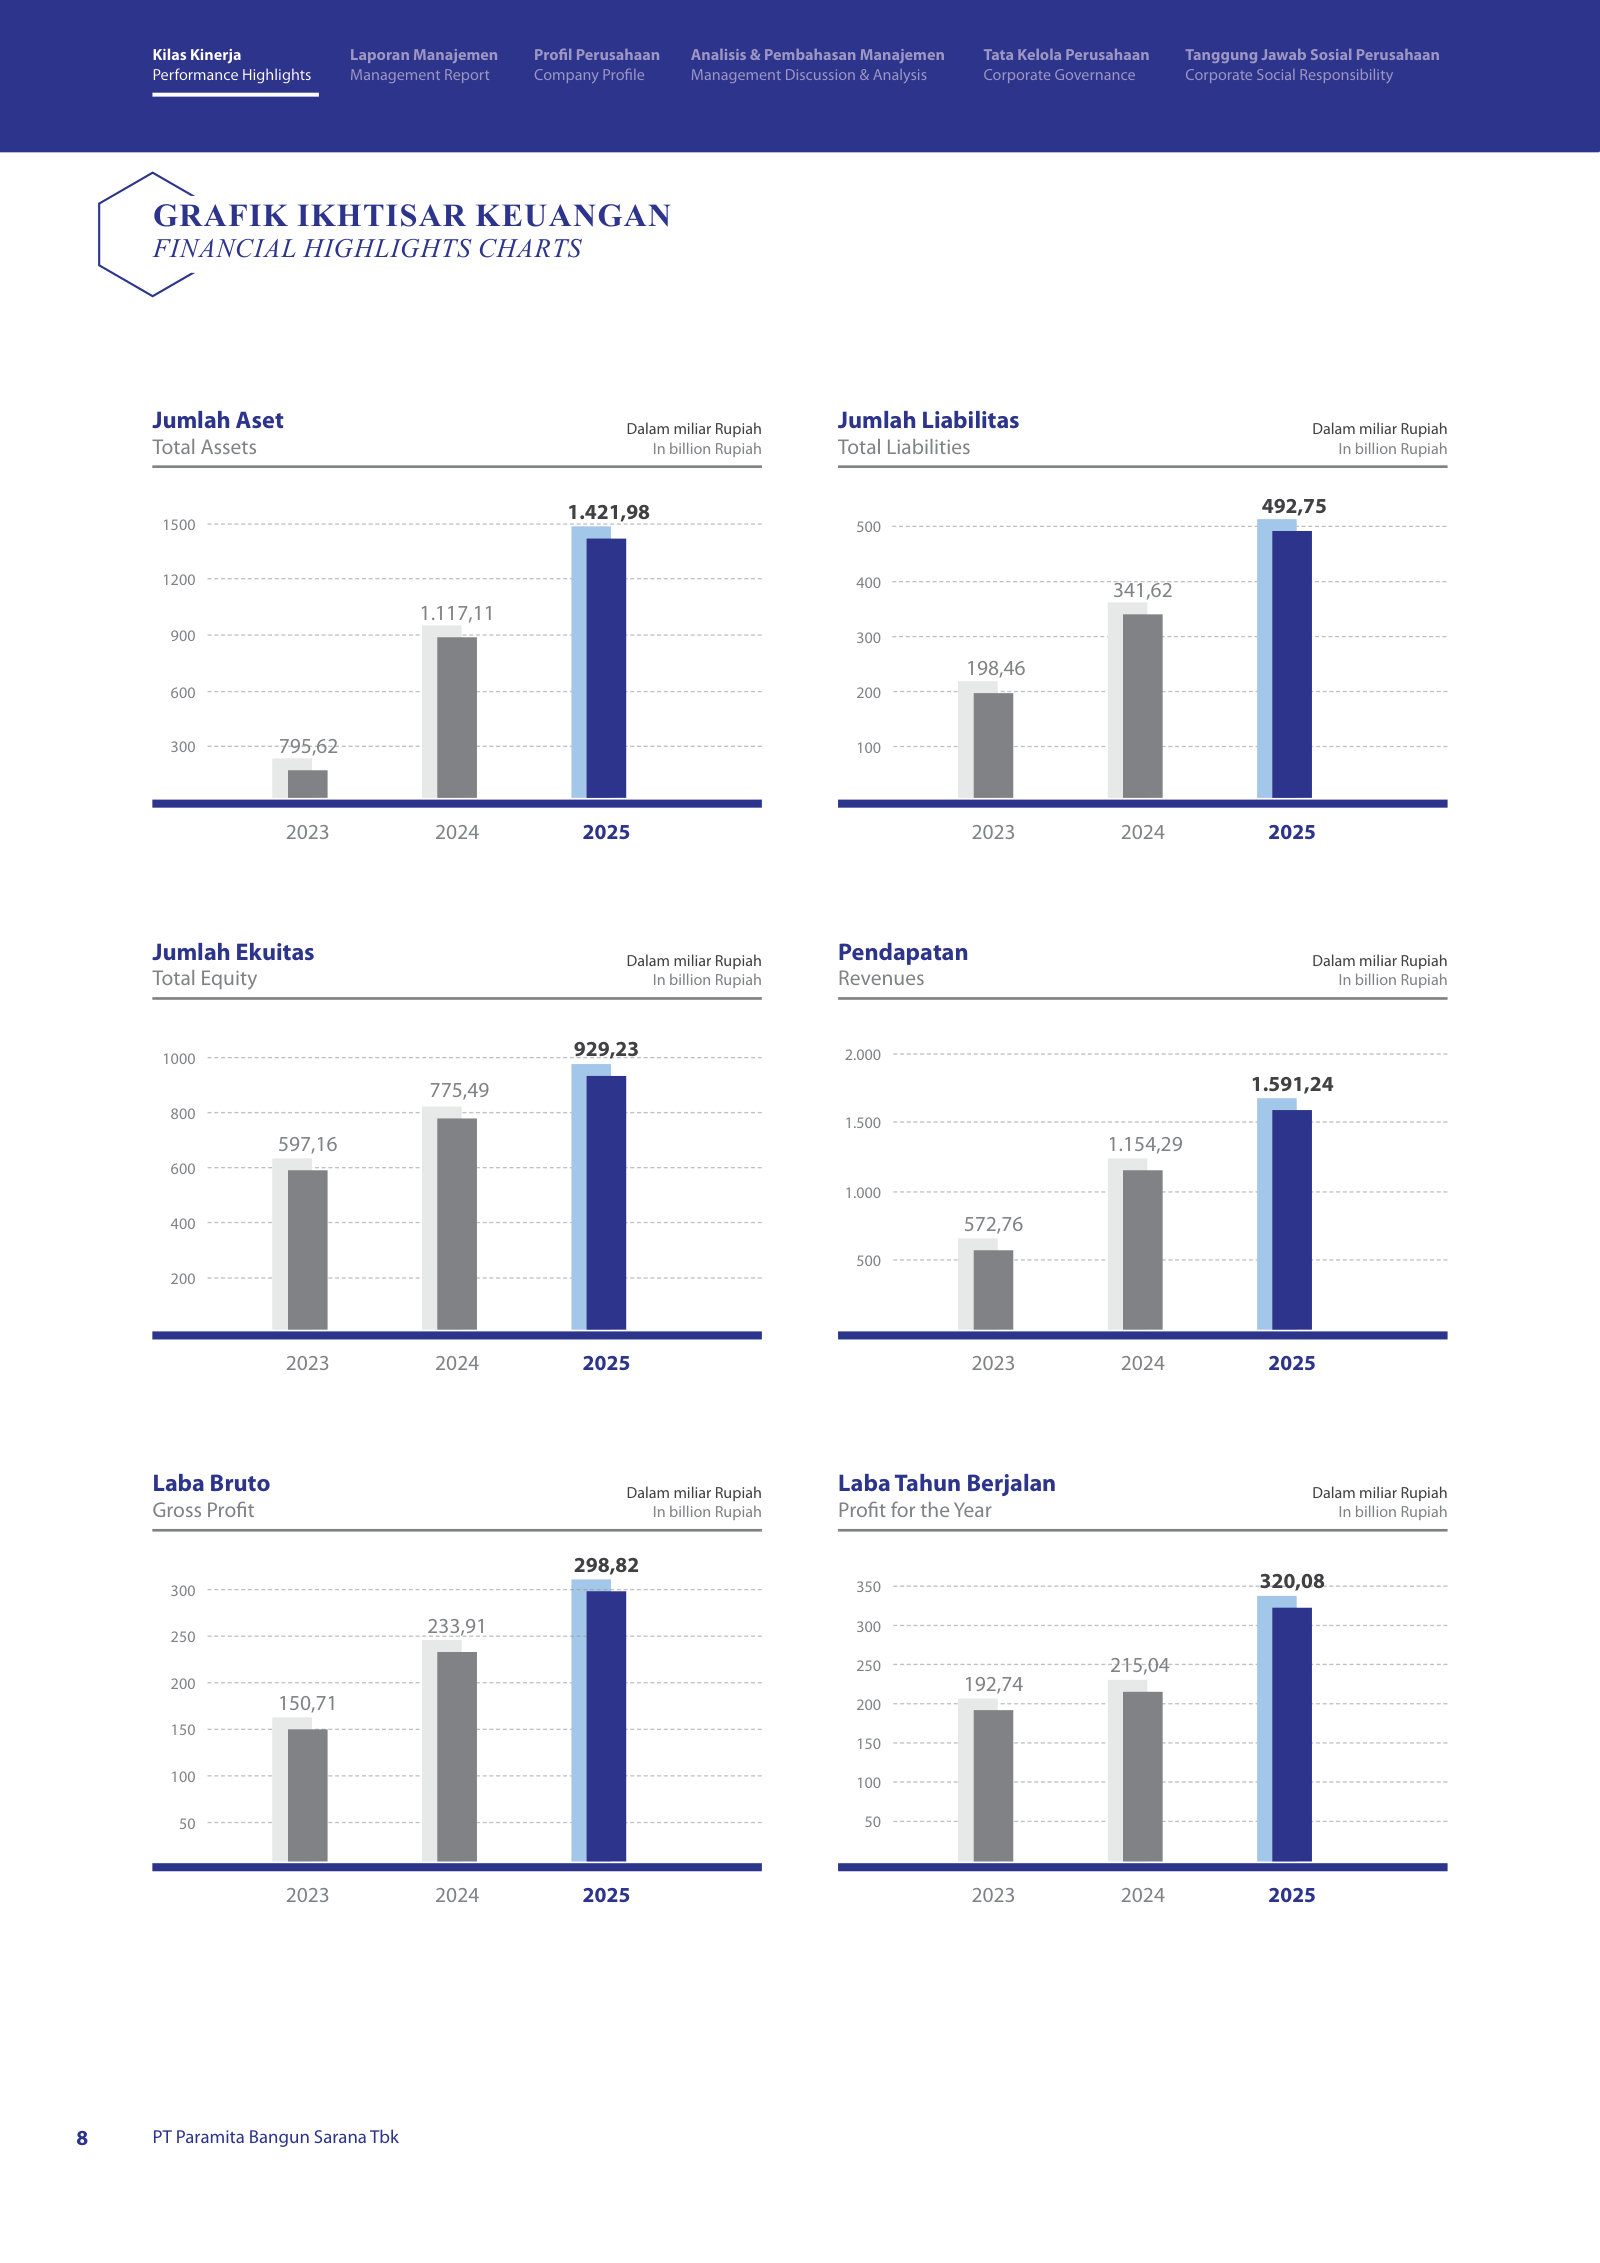
Financial Highlights Charts — p. 7 · Read the full section →
The three-year trajectory at a glance: revenue, profit, assets and equity all rising into 2025.
Board of Directors Report — p. 13 · Read the full section →
Management's own read on 2025 — what drove the year and where it is steering the business into 2026.
The demand engine: palm-oil refinery construction, tied to government downstreaming policy.
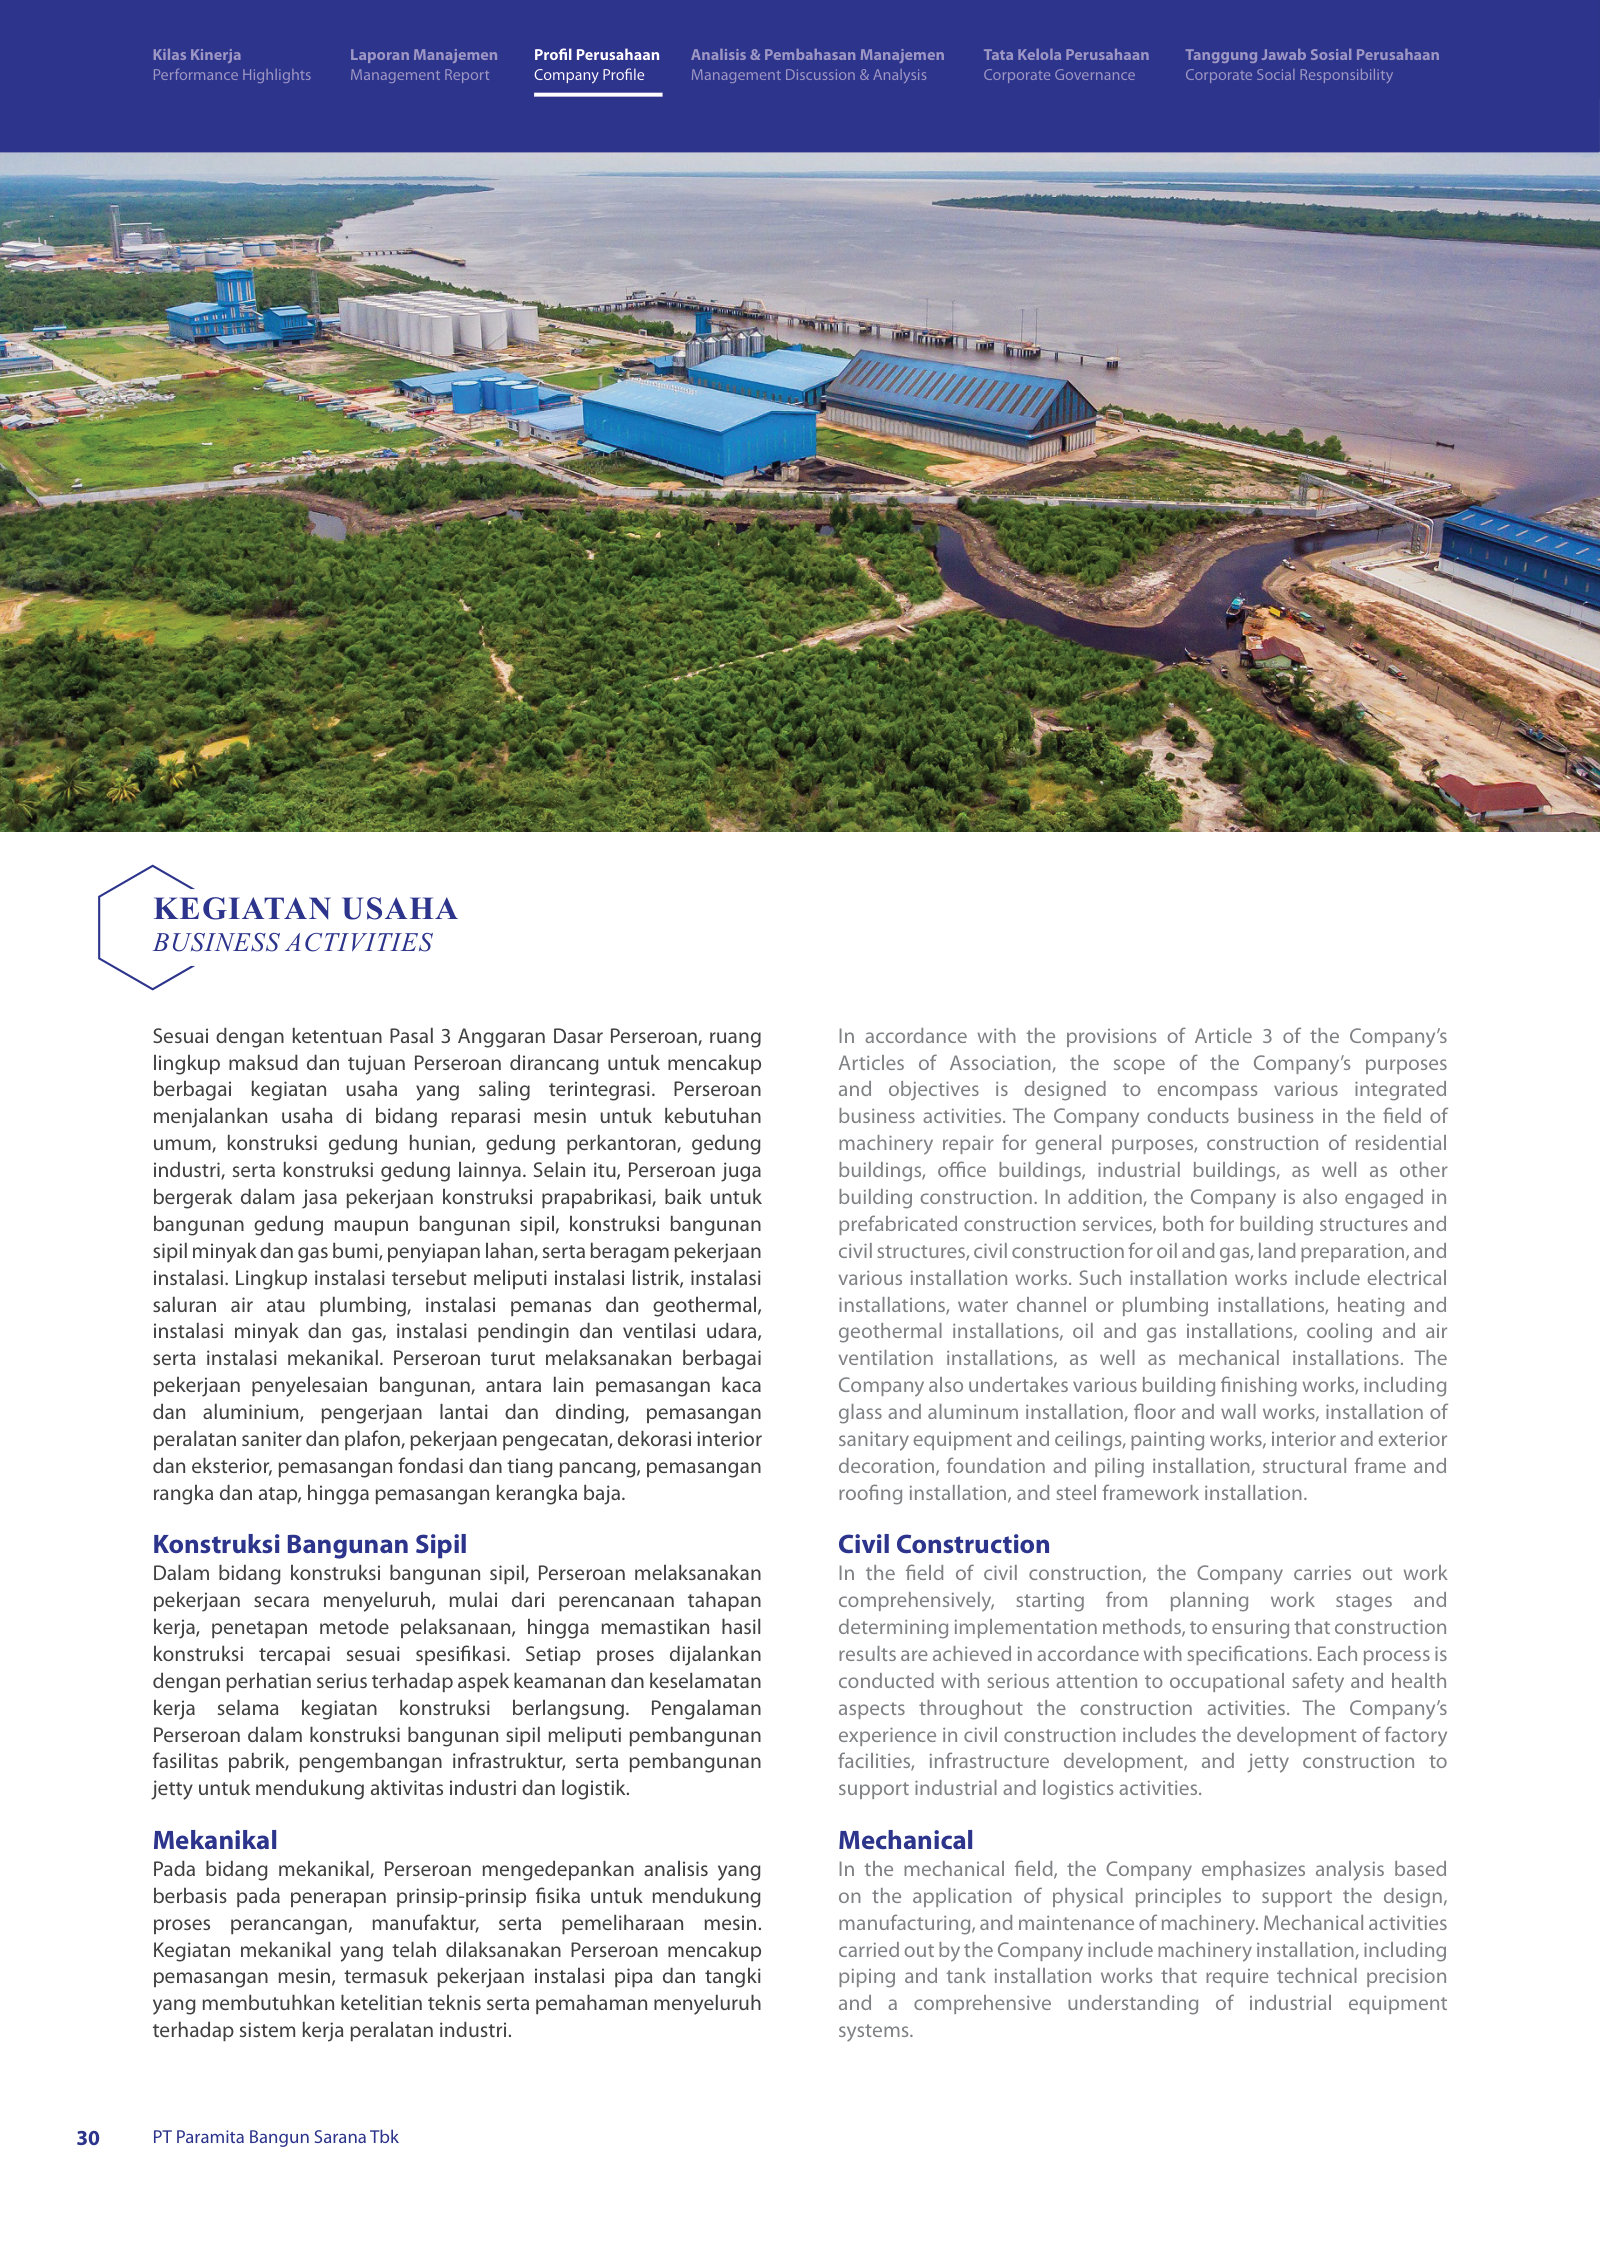
One of the subsectors that recorded significant growth was the development of palm oil processing facilities (refineries), driven by rising demand for value-added derivative products and the strengthening of downstreaming policies by the Government. This condition has increased the need for construction services with capabilities to handle highly complex industrial projects, including the integration of civil, mechanical, and electrical works.
p. 13 · Read in context →
FY2025 results in management's words: revenue +37.85% to Rp1,591bn, net profit Rp320bn.
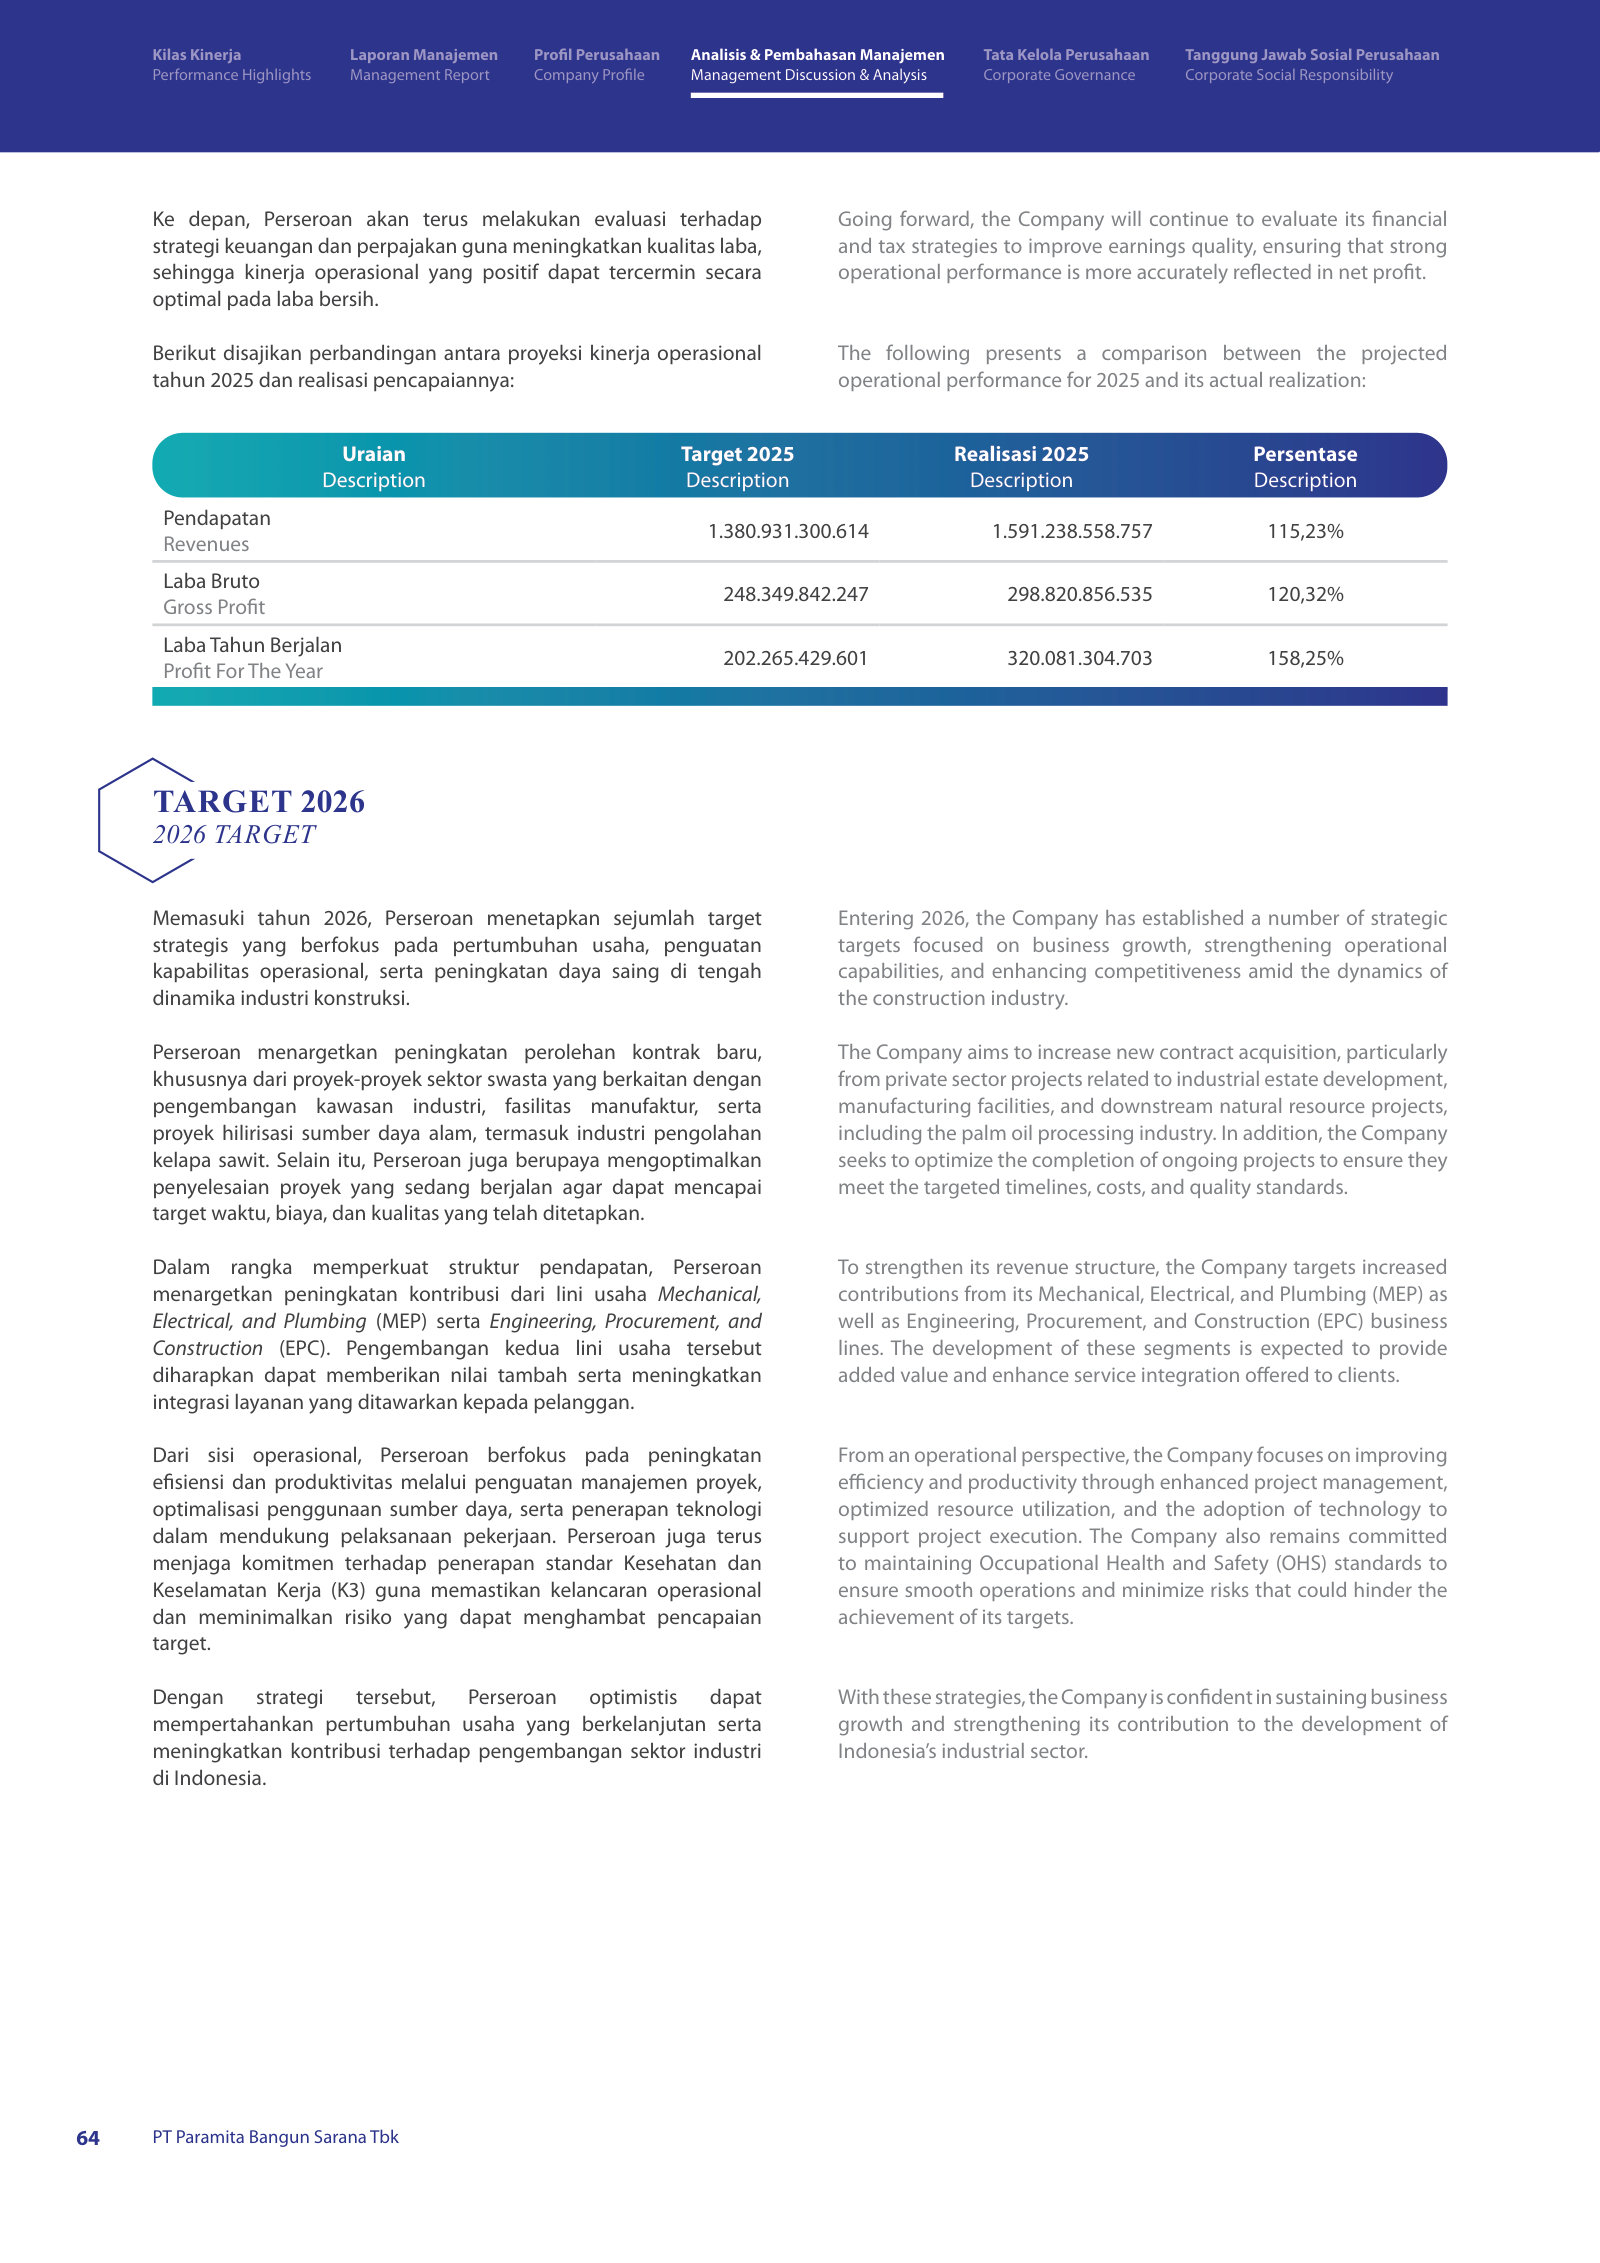
During the 2025 financial year, the Company successfully recorded significant revenue growth of Rp1,591.24 billion, an increase of approximately 37,85% compared to 2024’s Rp1,154.29 billion. […] In line with this performance, the Company recorded profit for the year of Rp320.08 billion, an increase from Rp215.04 billion in 2024.
p. 14 · Read in context →
Business Activities — p. 31 · Read the full section →
What the company actually does — civil, mechanical and electrical construction, with a stated concentration in palm oil.
Core competencies and the palm-oil-sector focus that concentrates the order book.
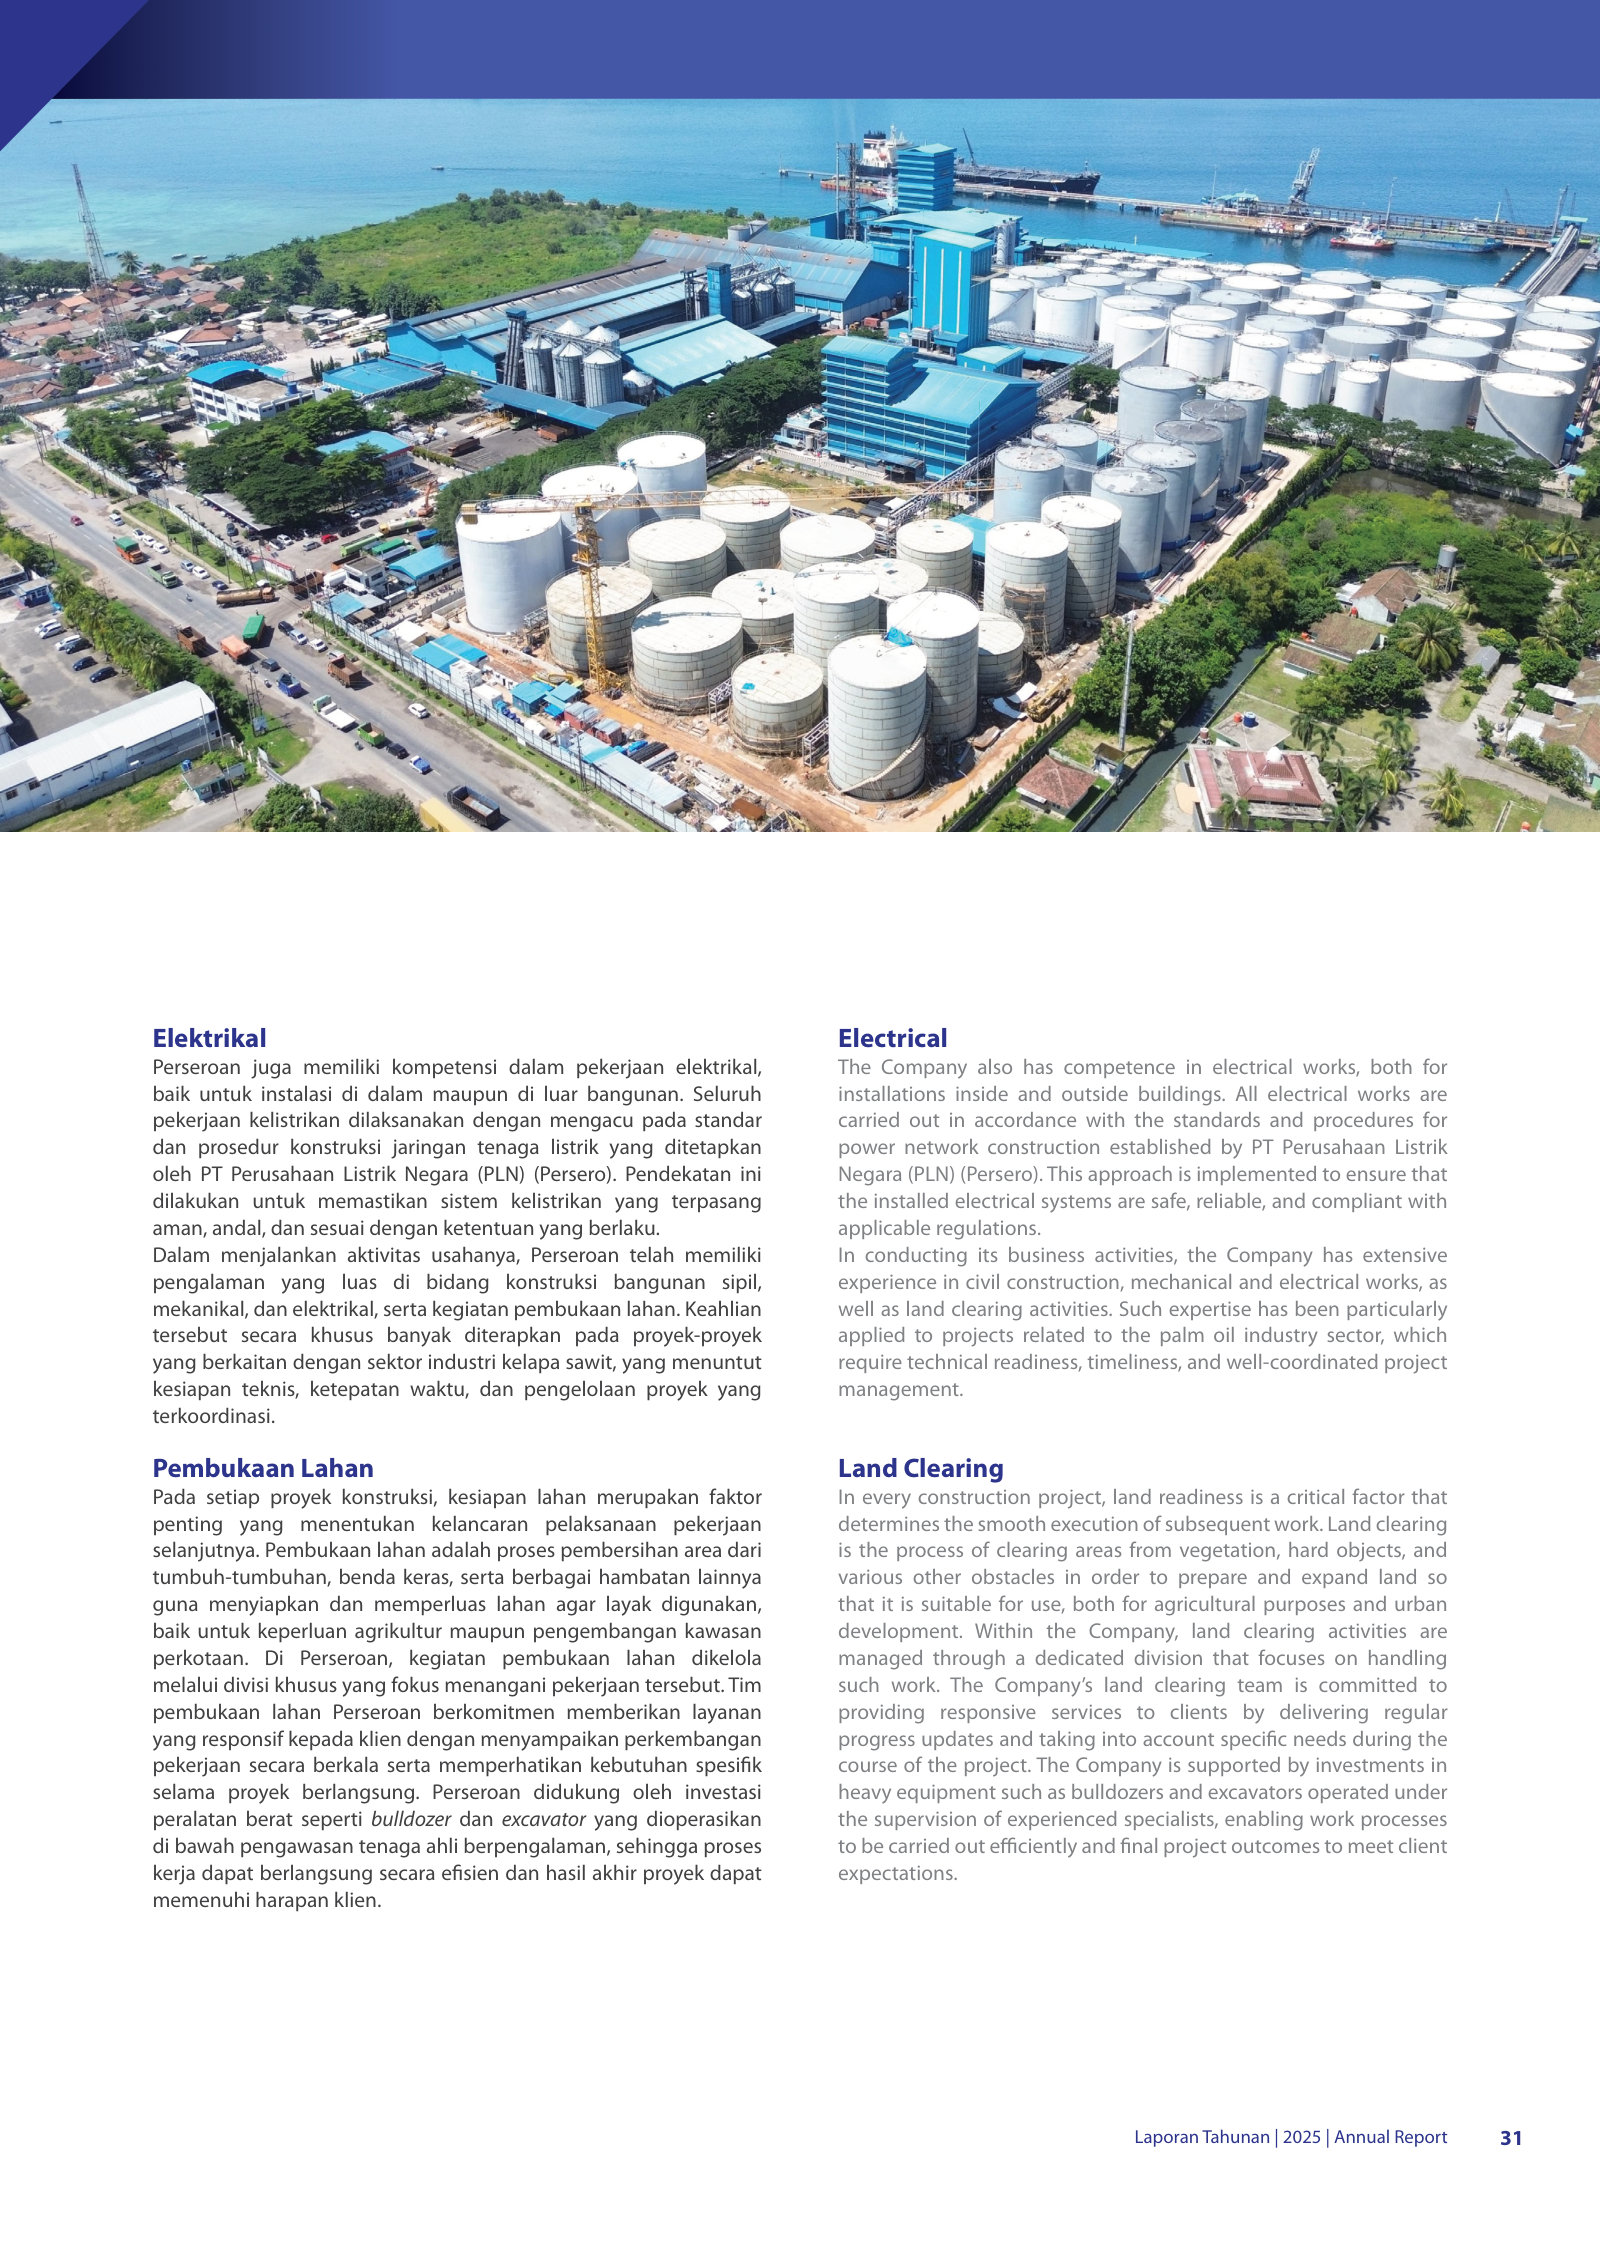
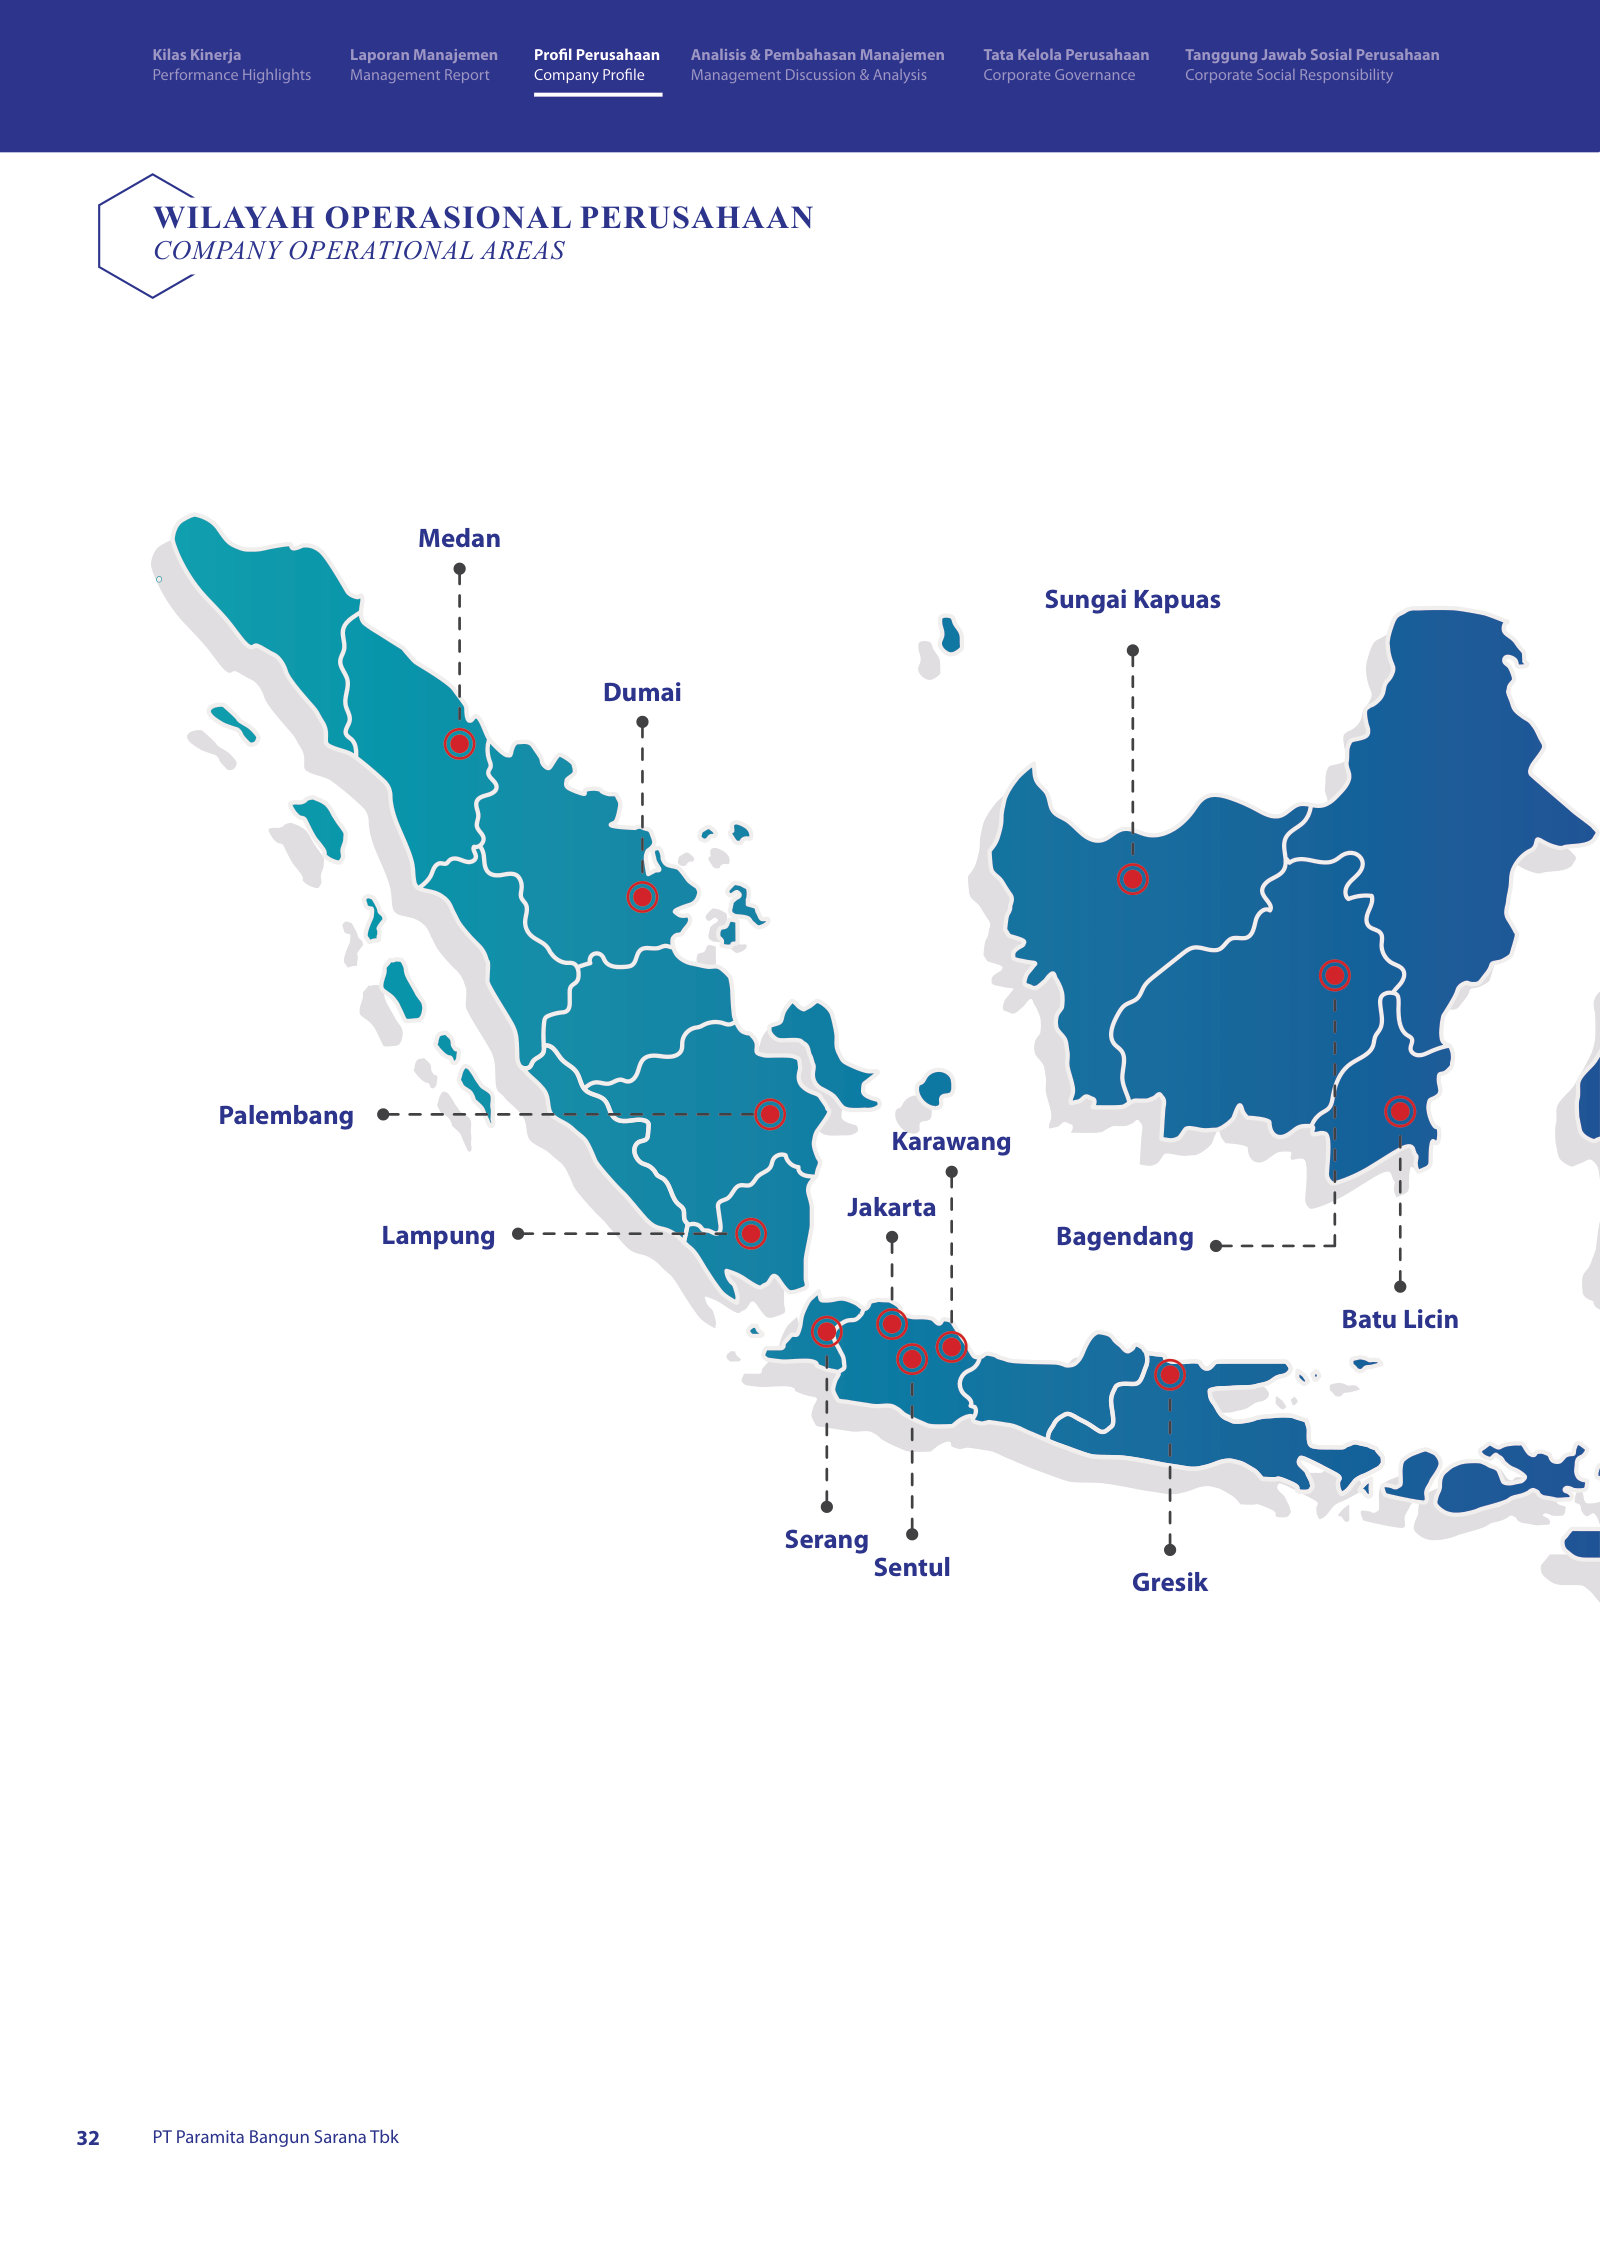
In conducting its business activities, the Company has extensive experience in civil construction, mechanical and electrical works, as well as land clearing activities. Such expertise has been particularly applied to projects related to the palm oil industry sector, which require technical readiness, timeliness, and well-coordinated projec management.
p. 32 · Read in context →
Business Segment Overview — p. 57 · Read the full section →
How the revenue is built: one segment carries the business, the others are supporting.
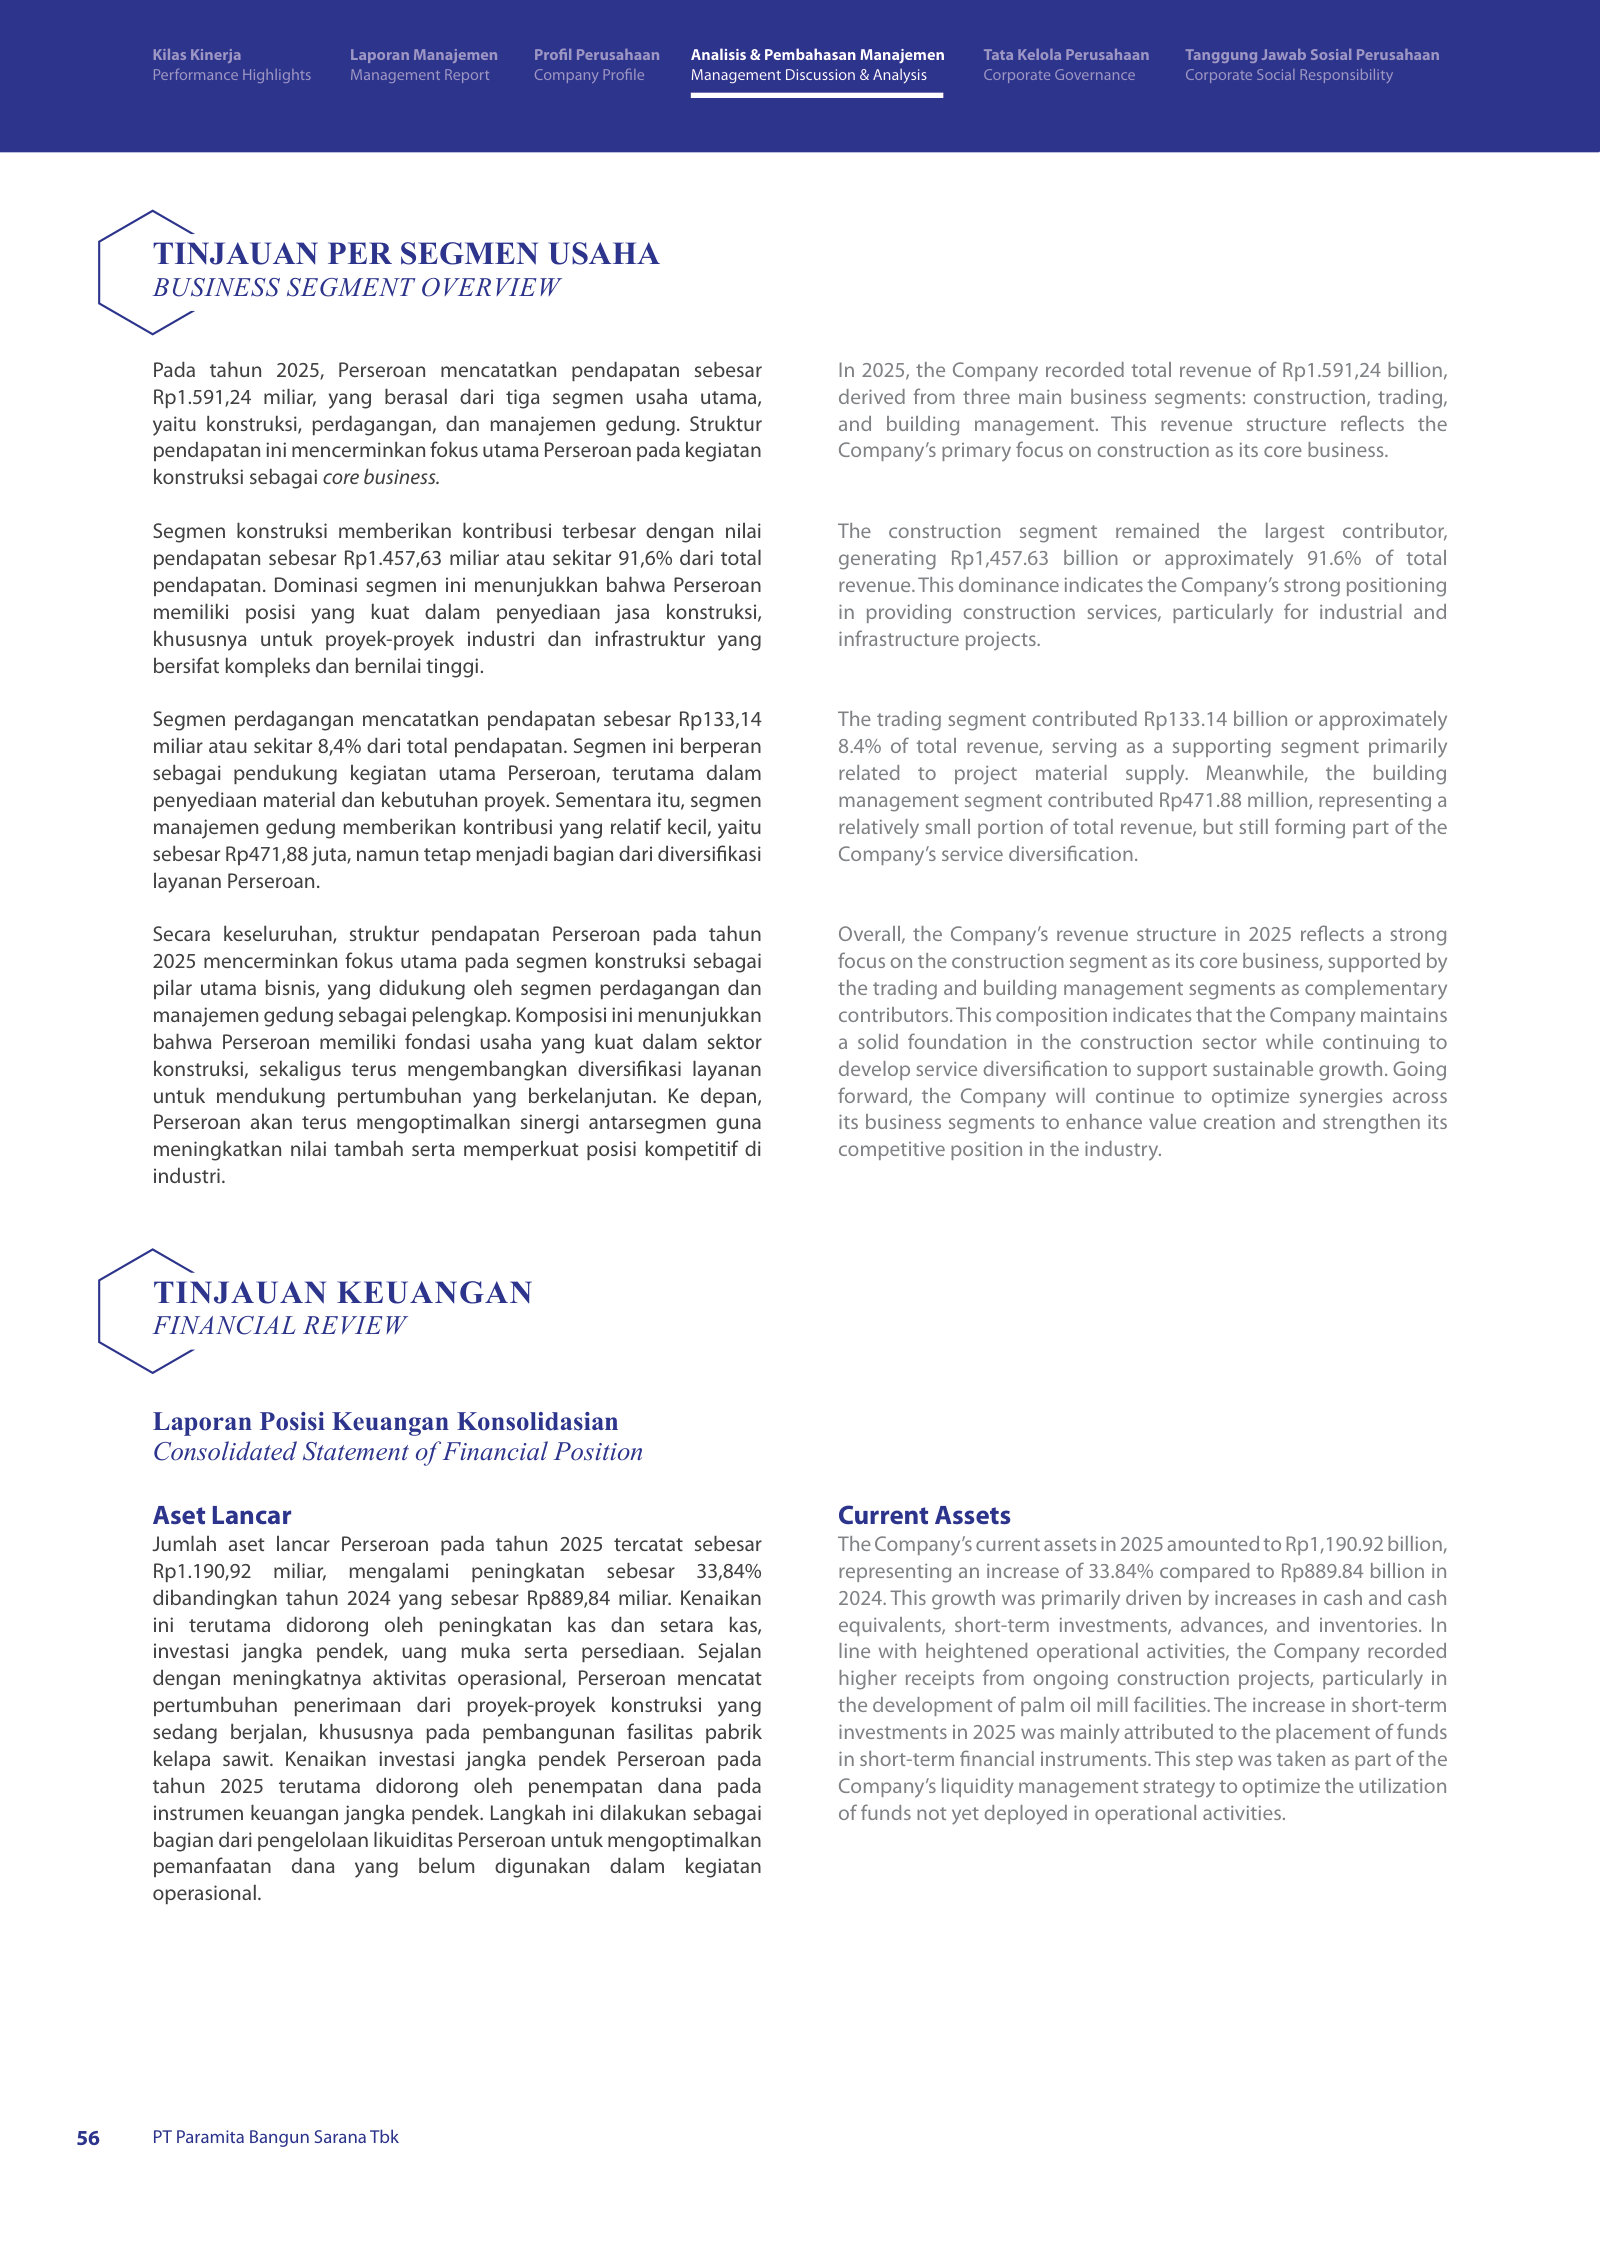
Revenue mix: construction 91.6%, trading 8.4%, building management immaterial.
The construction segment remained the largest contributor, generating Rp1,457.63 billion or approximately 91.6% of total revenue. […] The trading segment contributed Rp133.14 billion or approximately 8.4% of total revenue, serving as a supporting segment primarily related to project material supply. Meanwhile, the building management segment contributed Rp471.88 million, representing a relatively small portion of total revenue, but still forming part of the Company’s service diversification.
p. 57 · Read in context →
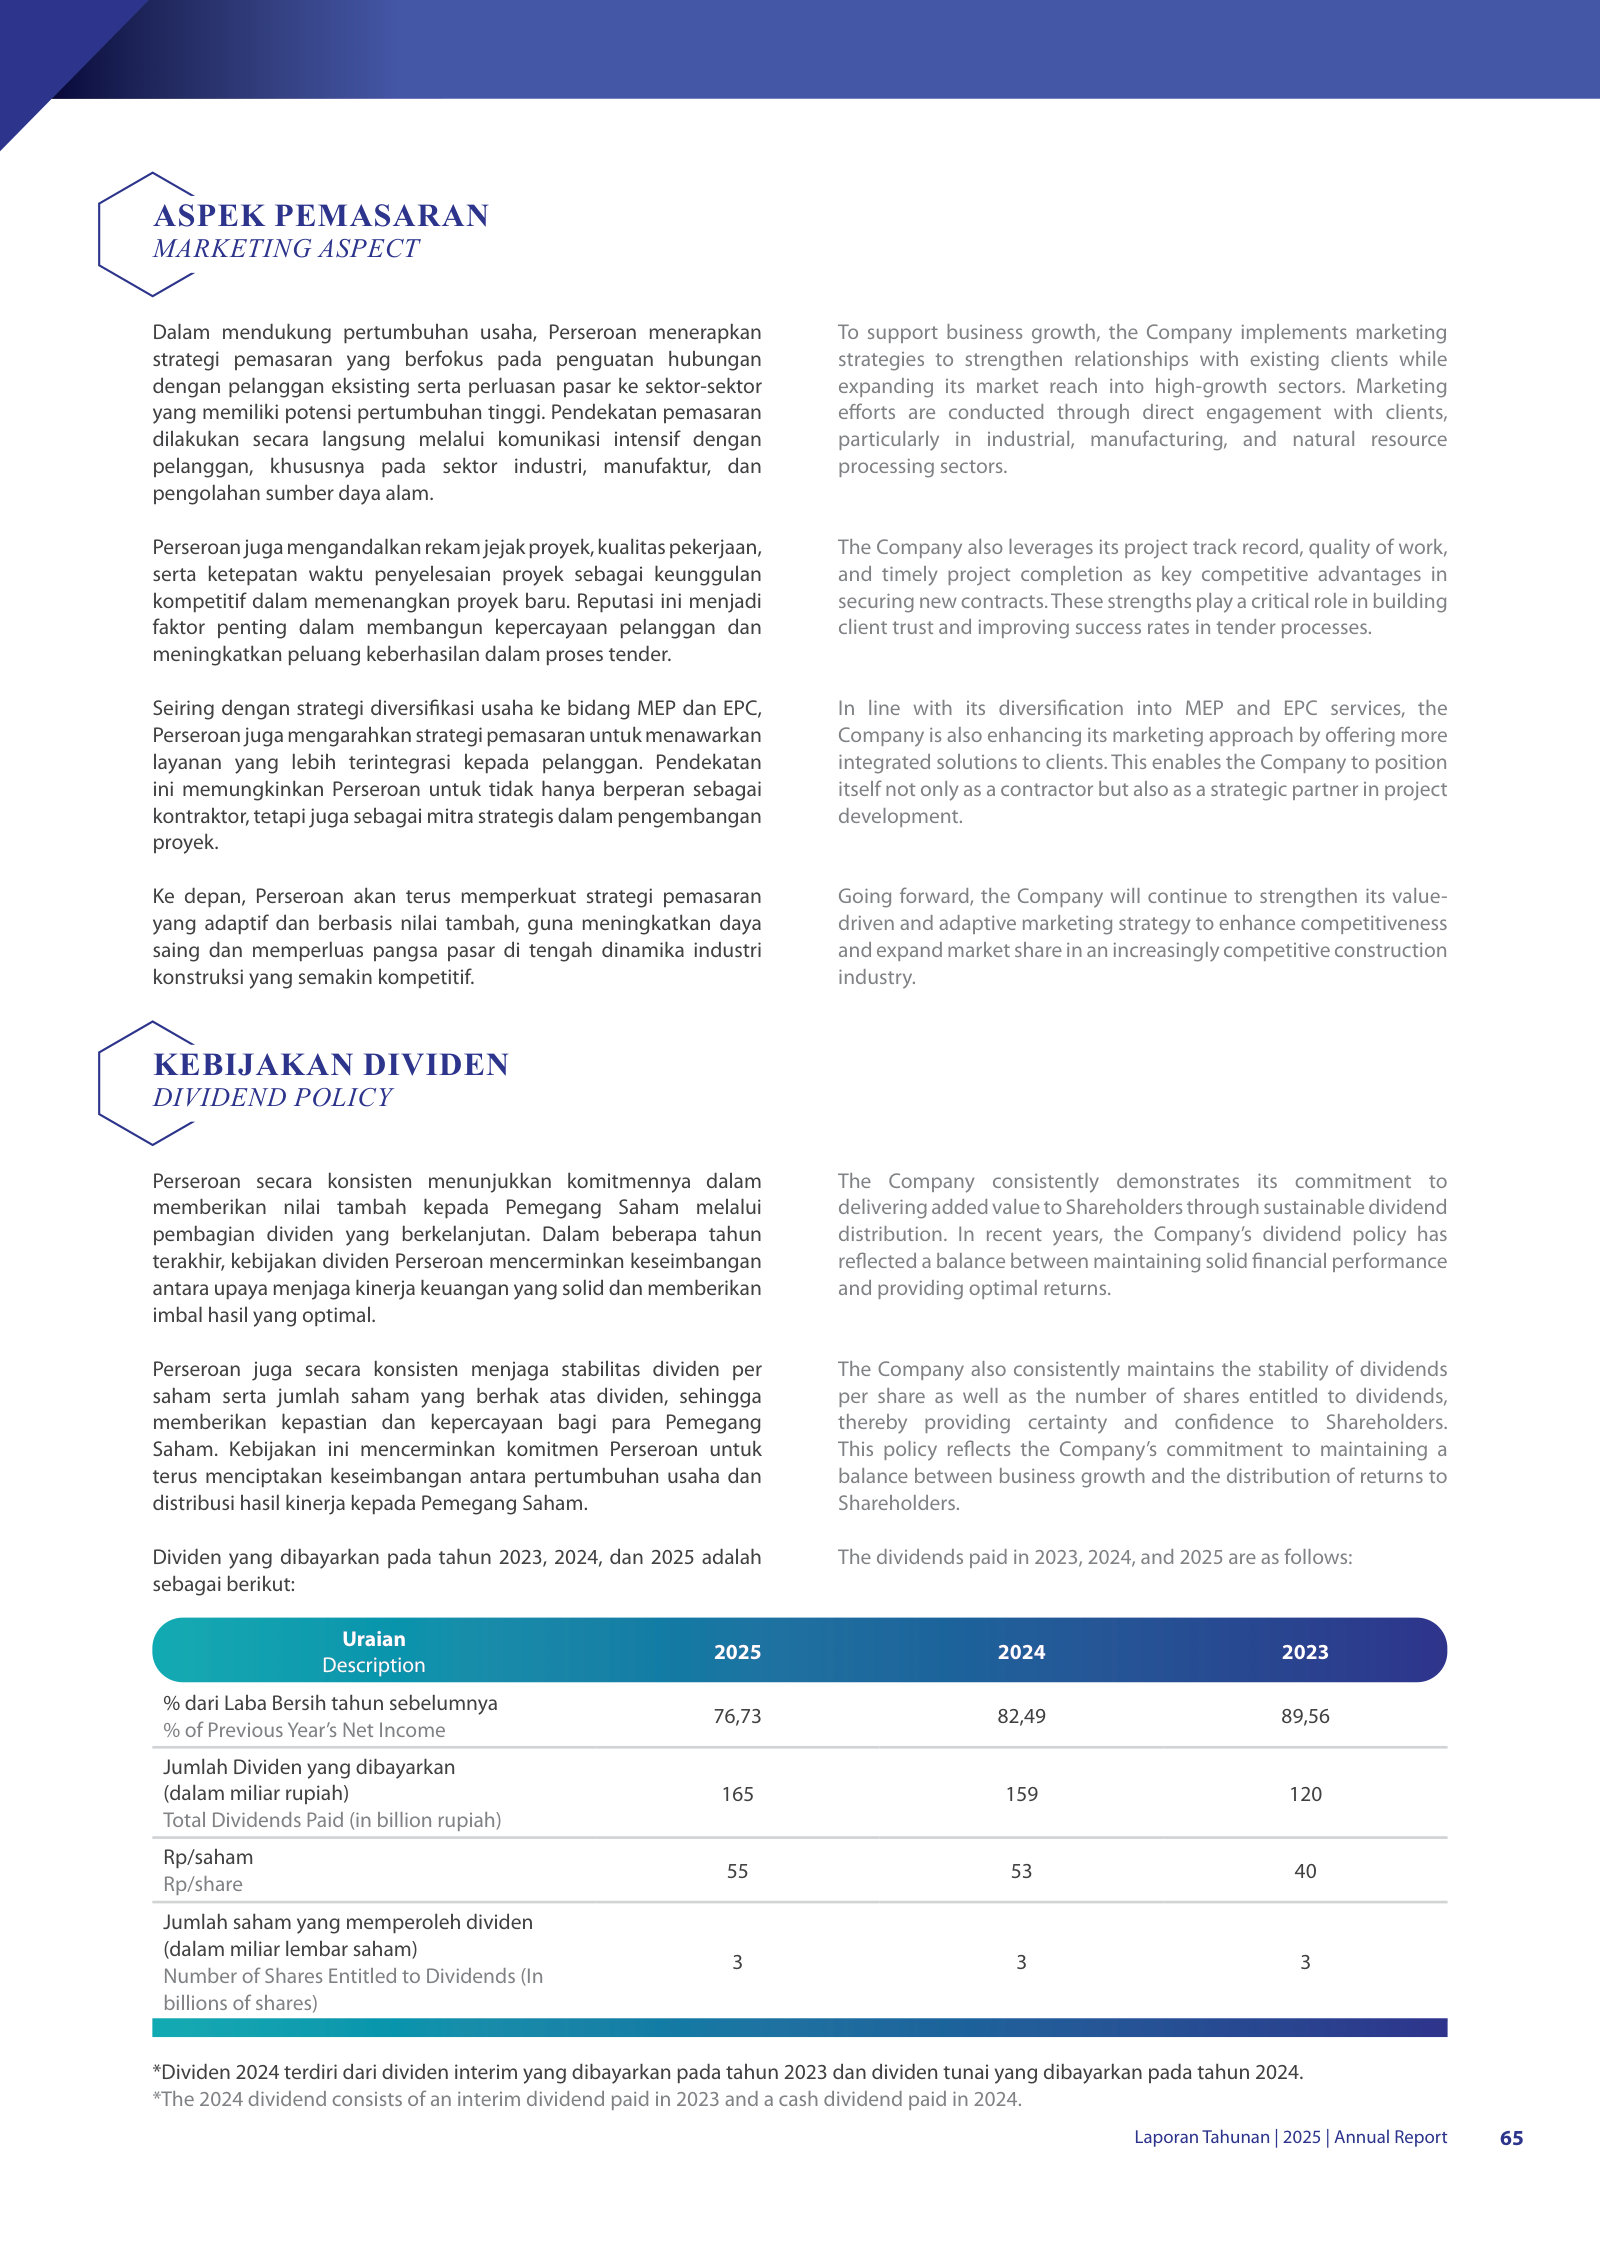
Dividend Policy — p. 66 · Read the full section →
A consistently high payout — a defining feature of the equity story for income-minded holders.
Revenue Recognition (Note 3q) — p. 187 · Read the full section →
The accounting that defines the model — construction revenue booked over time on physical progress.
Percentage-of-completion (output method), with full and immediate provisioning for expected contract losses.
Revenues related to construction contracts are accounted for using the percentage of completion method. Under this method, the revenue recognized equals the latest estimate of the total value of the contract multiplied by the actual completion rate determined by reference to the physical state of progress of the works (output method). […] If it is regarded as probable that a contract will generate a loss on completion, a provision for expected losses to completion is recognized as a current provision in the consolidated financial statements. The loss is provided for in full as soon as it can be reliably measured, irrespective of the completion rate.
p. 189 · Read in context →
Segment Information (Note 37) — p. 249 · Read the full section →
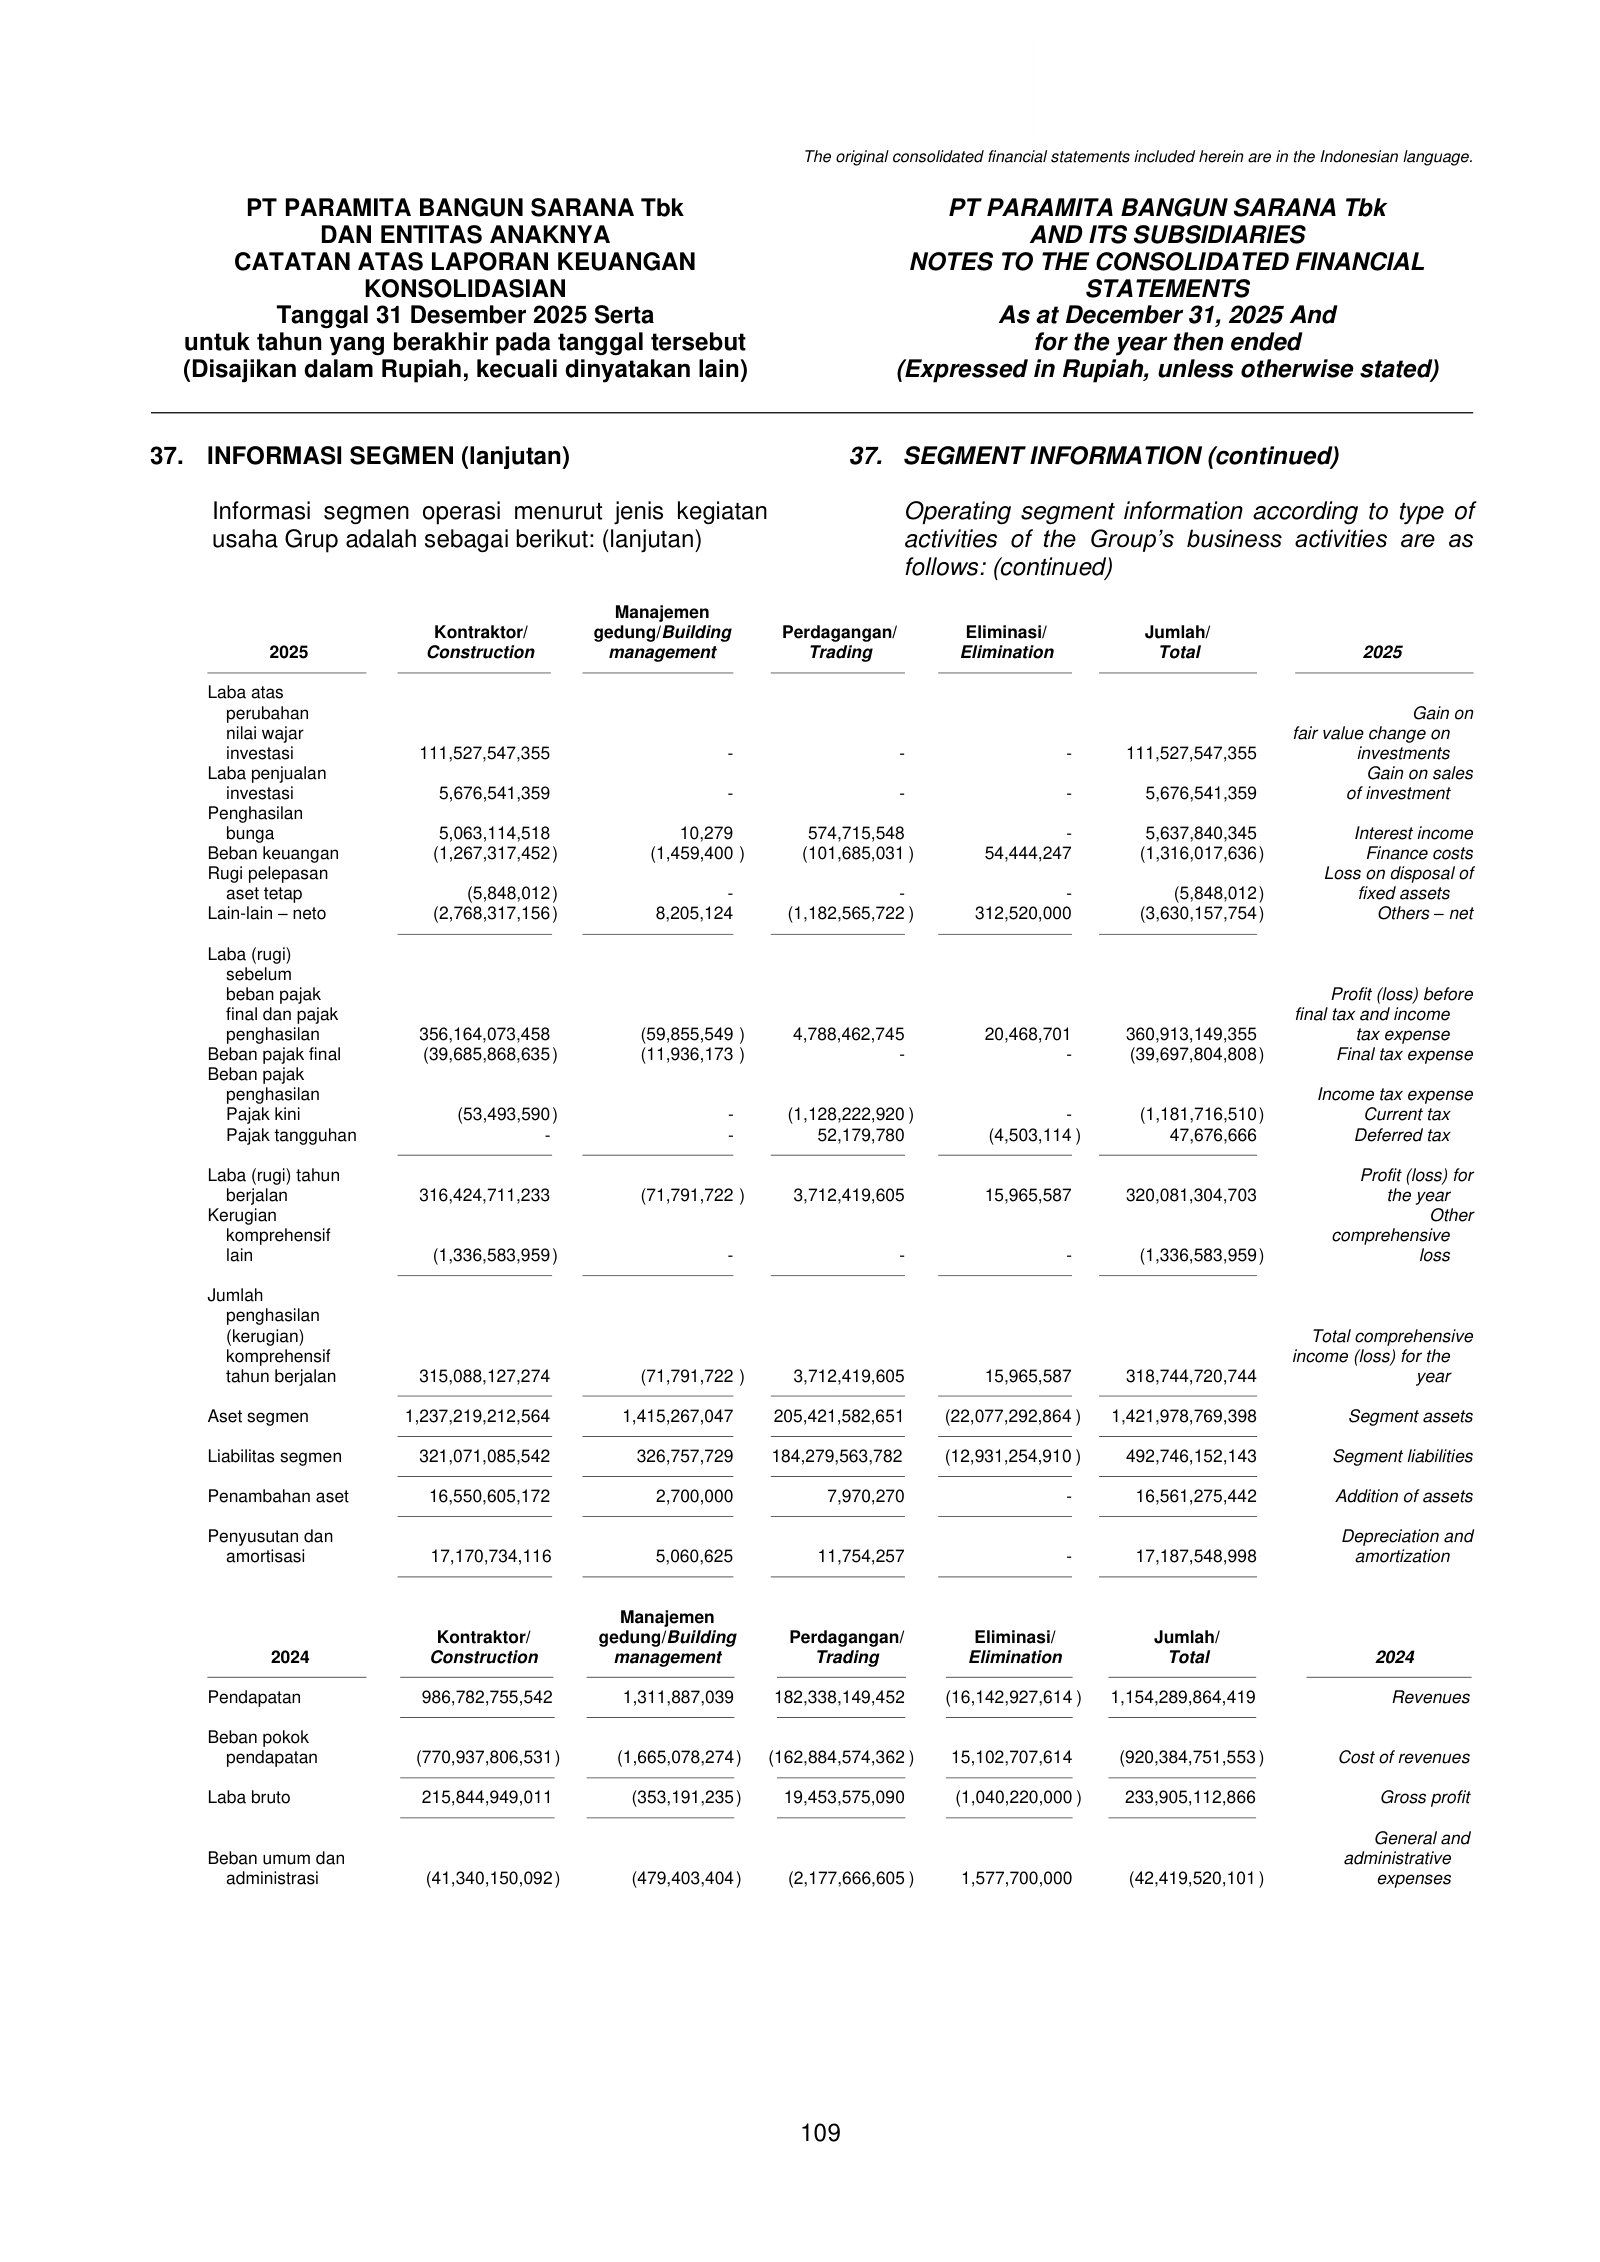
The audited segment P&L — and where it shows that a large slice of FY2025 profit is investment fair-value gains, not construction.
More annual reports
PT Paramita Bangun Sarana Tbk — FY2024 Annual Report — FY2024 · 303 pages · The prior year and comparison base — revenue Rp1,154bn, before the FY2025 step-up in scale. · Open →
PT Paramita Bangun Sarana Tbk — FY2023 Annual Report — FY2023 · 260 pages · A quieter year (revenue Rp573bn) that frames how sharply the business scaled afterward. · Open →
PT Paramita Bangun Sarana Tbk — FY2022 Annual Report — FY2022 · 268 pages · Earlier baseline for the order book and dividend track record. · Open →
PT Paramita Bangun Sarana Tbk — FY2021 Annual Report — FY2021 · 262 pages · The oldest edition on file — useful for the longer-run view of margins and payout. · Open →
Two engines behind a record year
Figures converted from Indonesian rupiah (IDR) at historical FX rates — see data/company.json.fx_rates. Ratios, margins, and multiples are unitless and unchanged.
PT Paramita Bangun Sarana (PBSA) is a small, debt-free Indonesian contractor that builds palm-oil mills, refineries and jetties, almost entirely for companies in the Sinar Mas and Golden Agri palm-oil group. Its FY2025 profit of $19.2m was a record, but roughly a third of pretax profit came not from construction — it came from unrealized gains on a $19.7m portfolio of managed funds. This chapter maps the business and fixes the question the report is built to answer.
What PBSA is
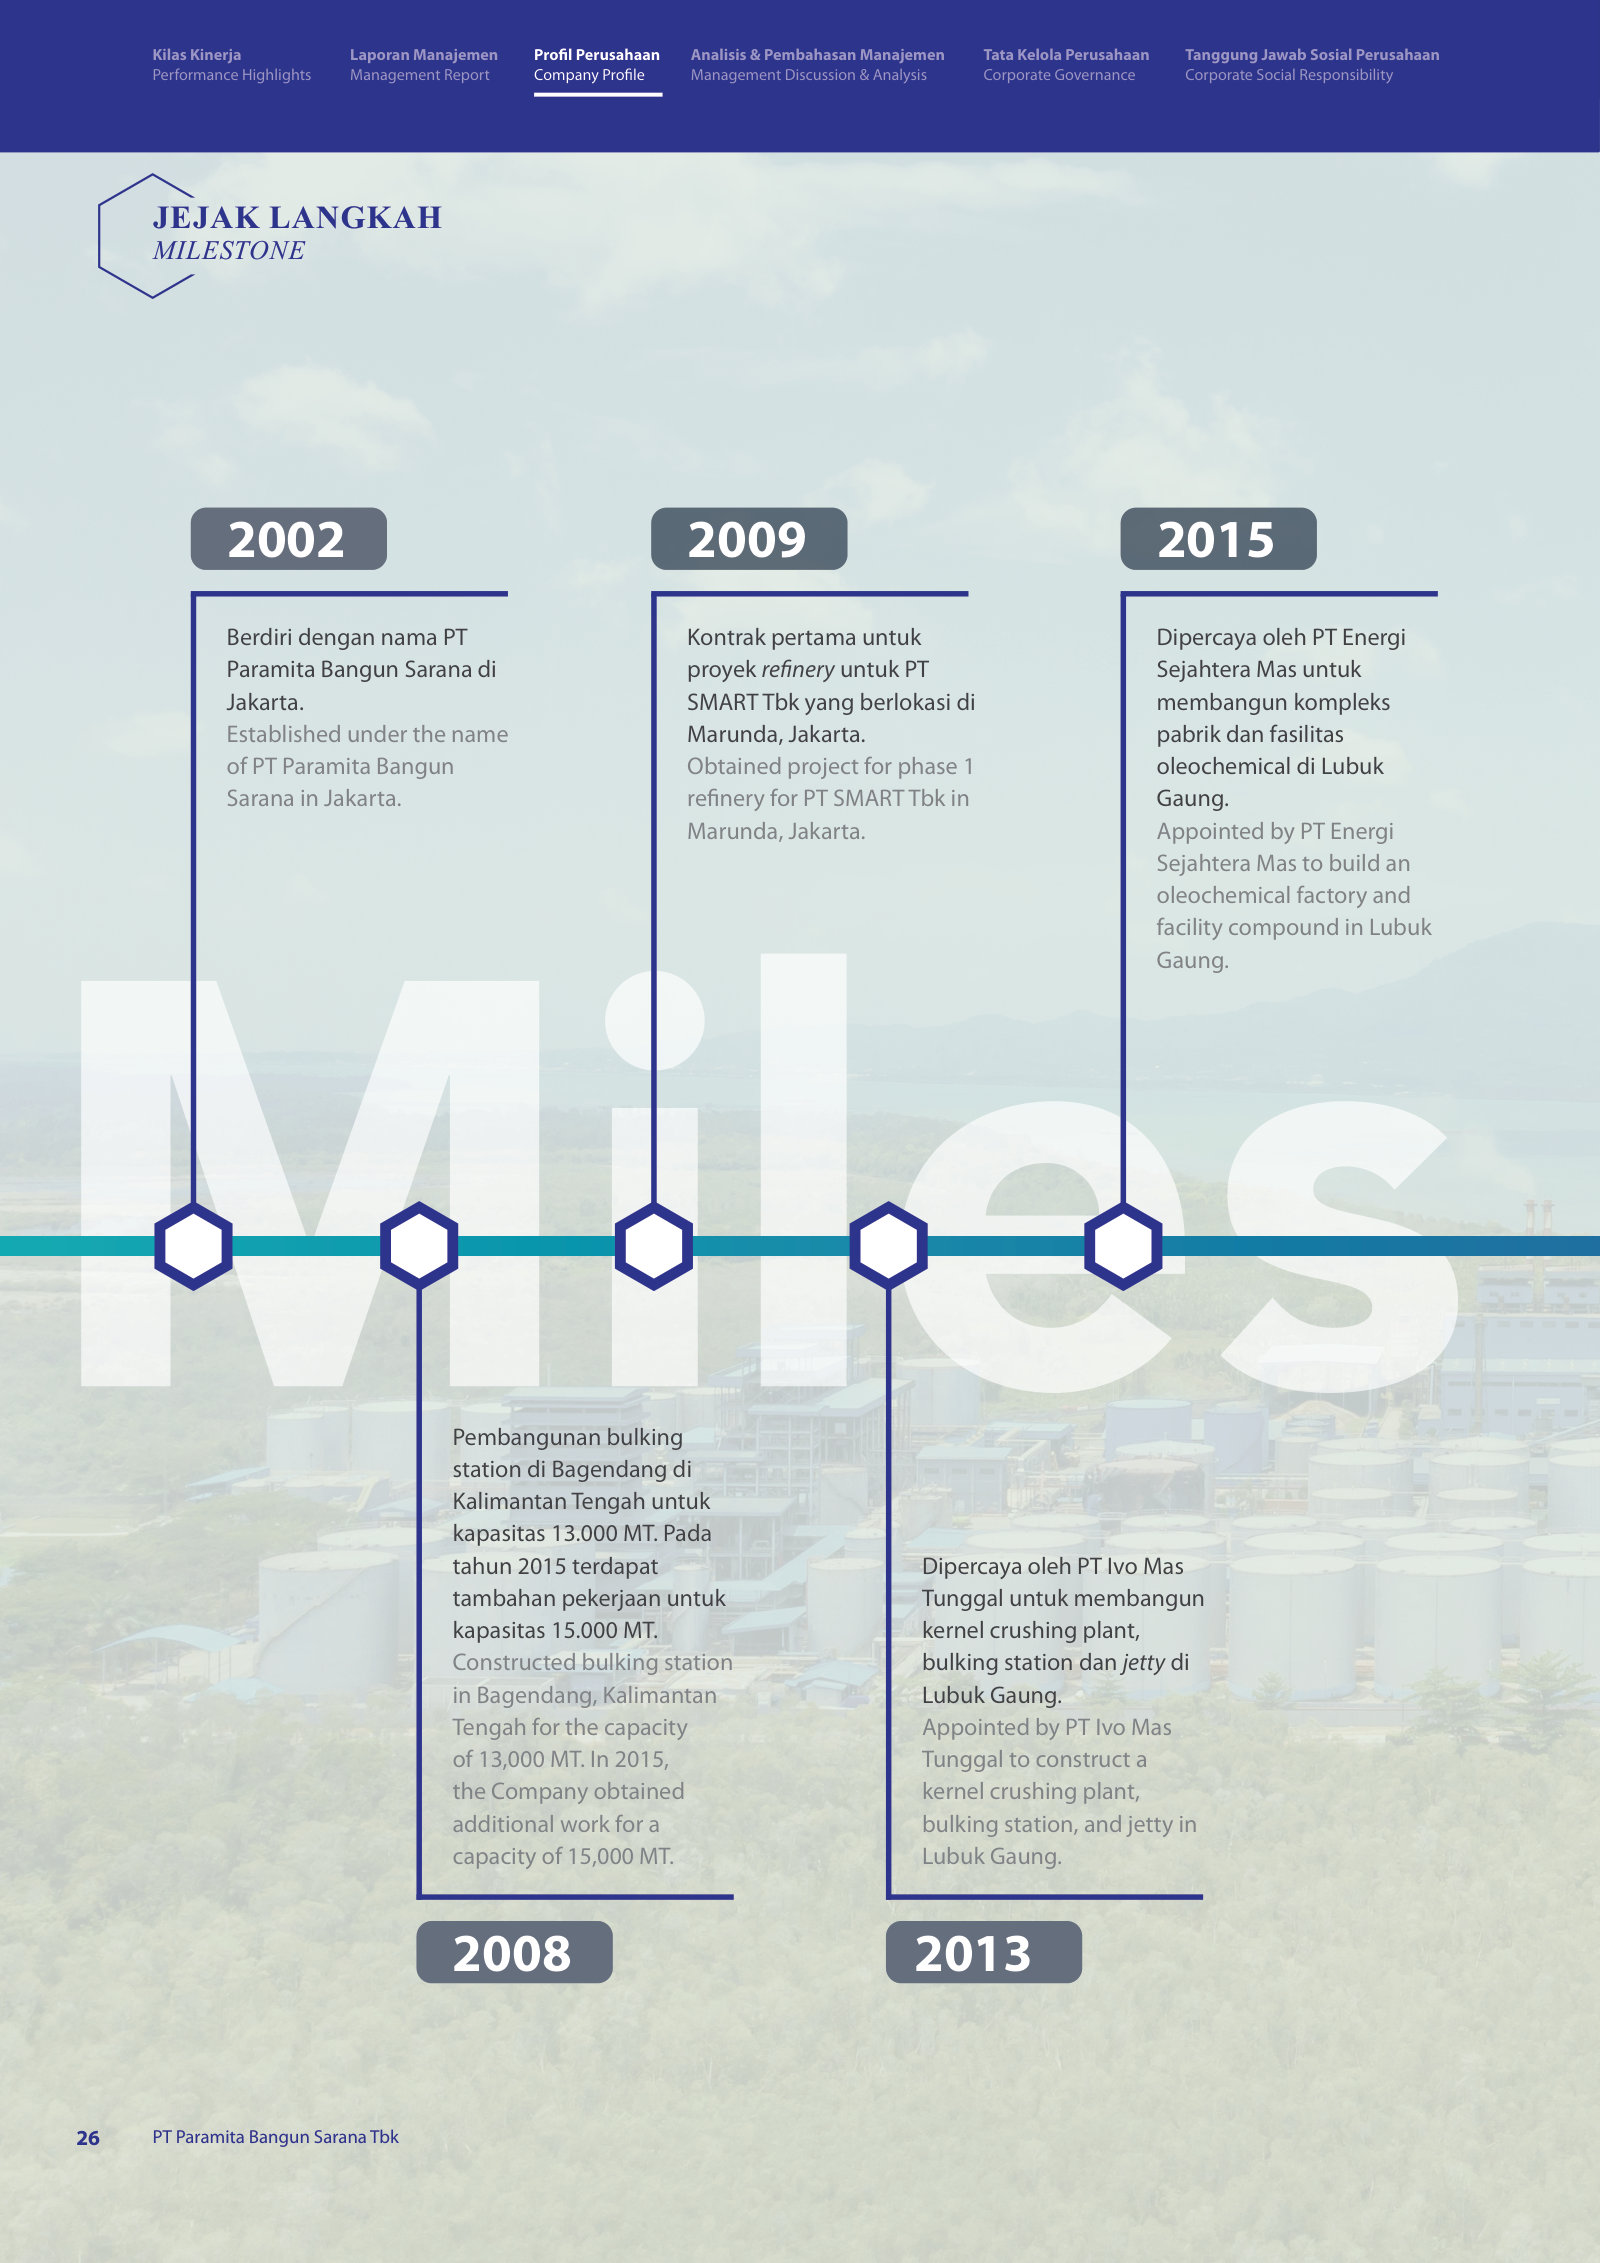
Paramita Bangun Sarana was founded on 27 November 2002 and listed on the Indonesia Stock Exchange on 28 September 2016, selling 300 million new shares [1]. It is a construction contractor whose expertise has been "particularly applied to projects related to the palm oil industry" — building the roads into plantations, the mills, the refineries, the tank farms and the jetties that move crude palm oil onto ships [2]. Around this core sits a small trading arm and a negligible building-management unit; construction was about 85% of FY2024 revenue.
That palm-oil focus is also a concentration. Every customer that individually exceeded 10% of FY2025 revenue belongs to the same industrial group: PT Sinar Mas Agro Resources and Technology, PT Soci Mas, PT Binasawit Abadipratama, PT Ivomas Tunggal and PT Sumber Indah Perkasa [3]. PBSA's order book, in other words, rises and falls with one ecosystem's decision to build palm-oil processing capacity.
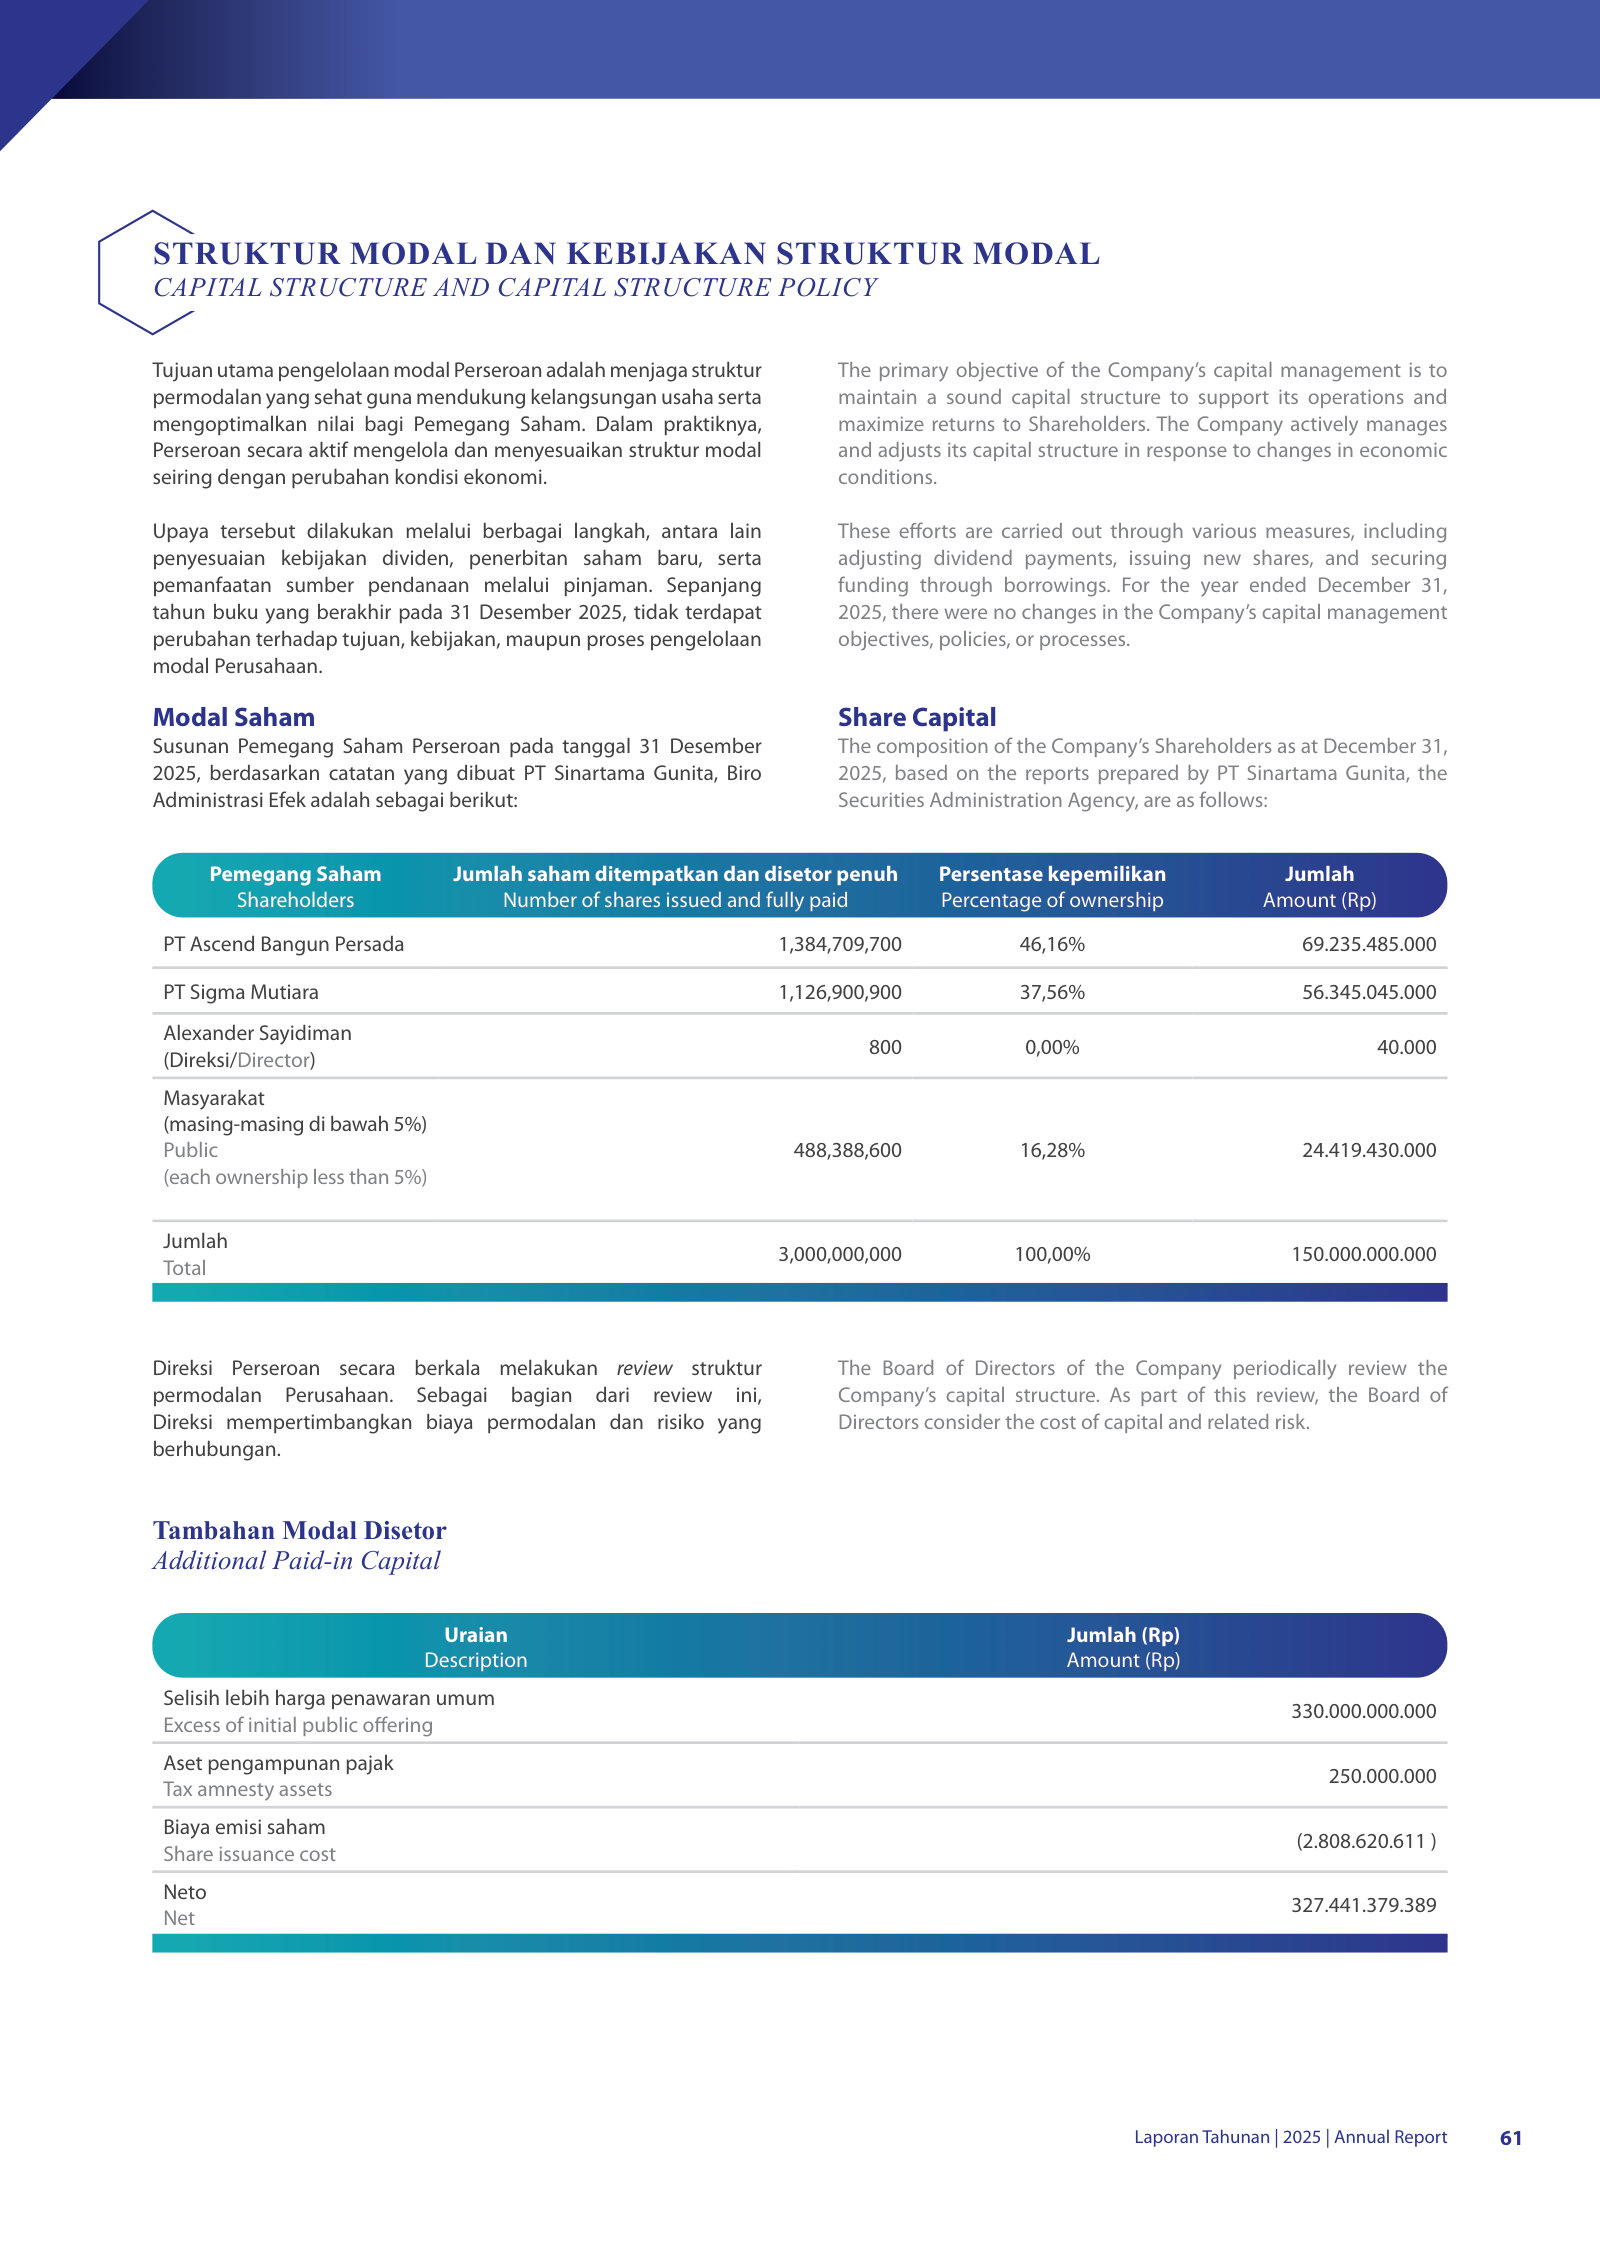
Ownership is equally concentrated. Two private holding companies — PT Ascend Bangun Persada (46.16%) and PT Sigma Mutiara (37.56%) — hold 83.7% of the 3.0 billion shares between them, leaving a public float of 16.28% [4]. A thin float matters later, when the share price is discussed.
FY2025 Revenue ($M)
FY2025 Net Profit ($M)
FY2025 EPS (USD)
Return on Equity
Source: FY2025 Annual Report, Financial Highlights [5] and Consolidated Statement of Profit or Loss [6]; ROE derived from reported net profit and equity.
The construction engine is lumpy
Project-based contracting does not compound smoothly, and PBSA's does not. Revenue has swung from $93.9m in 2016 — the year it went public — down to a $19.5m trough in 2021, then up to a fresh record of $95.5m in 2025 [7]. A single large mill or tank-farm contract landing or completing in a given year moves the whole top line. (Part of the 2016-to-2021 swing reflects a weakening rupiah as well as volume; the rupiah decline is why USD revenue falls more than the underlying activity.)
Source: reported consolidated income statements, FY2016–FY2025, per the FY2025 Annual Report three-year summary [8] and earlier filings; converted at each year's period-end FX.
The balance sheet that carries this volatility is unusually clean. At end-2025 PBSA held $8.7m of cash and $19.7m of short-term investments against total debt of about $1k — effectively no borrowings — on $55.8m of equity [9]. Reported returns are high: FY2025 return on equity was 34% and the operating margin 15%.
Cash generation, though, is as lumpy as revenue. In FY2024 the company reported $13.3m of net profit yet burned $2.7m of operating cash as receivables and contract assets built up; in FY2025 operating cash flow swung to a positive $22.0m [10]. Over a full cycle the cash arrives, but in any single year reported profit and cash can point in opposite directions — a working-capital pattern normal for percentage-of-completion contractors, and one worth watching in the years it diverges.
The second engine is a securities portfolio
The more distinctive feature of recent results sits below the operating line. In FY2025, operating income was $14.6m, but profit before tax was $21.7m — a $7.1m gap [11]. Almost all of that gap is one line: a $6.7m "gain on fair value change on investments" ($2.4m in FY2024). It is an unrealized mark-to-market gain, not a sale, and it equals 31% of FY2025 pretax profit.
Source: FY2025 Annual Report, Consolidated Statement of Profit or Loss [12] and Financial Highlights [13]; non-operating income is profit before tax less operating income.
This non-operating engine is new at scale. The portfolio behind it — classified as "financial assets at fair value through profit or loss, held-for-trading" — grew from $5.5m at end-2024 to $19.7m at end-2025, nearly a quarter of total assets. It holds mostly managed funds: Nusadana Fixed Income, KPD Nusadana, Juara Capital and Nusadana Balanced Fund, plus a token equity stake [14]. One holding drives much of the gain: KPD Nusadana, a discretionary managed account, was revalued from $0.055 to $0.152 per unit over 2025 — a 187% mark-up on an unchanged 46.3 million units [15].
That is a large, illiquid, marked-to-model position contributing nearly a third of headline profit, and it deserves its own forensic look before the recent earnings trajectory is taken at face value. The pattern is not a one-off — the operating-to-pretax gap was even wider in FY2023, at $8.6m — which makes the durability of these gains a live question rather than a footnote.
The stock: a thin float, a spike, and a round-trip
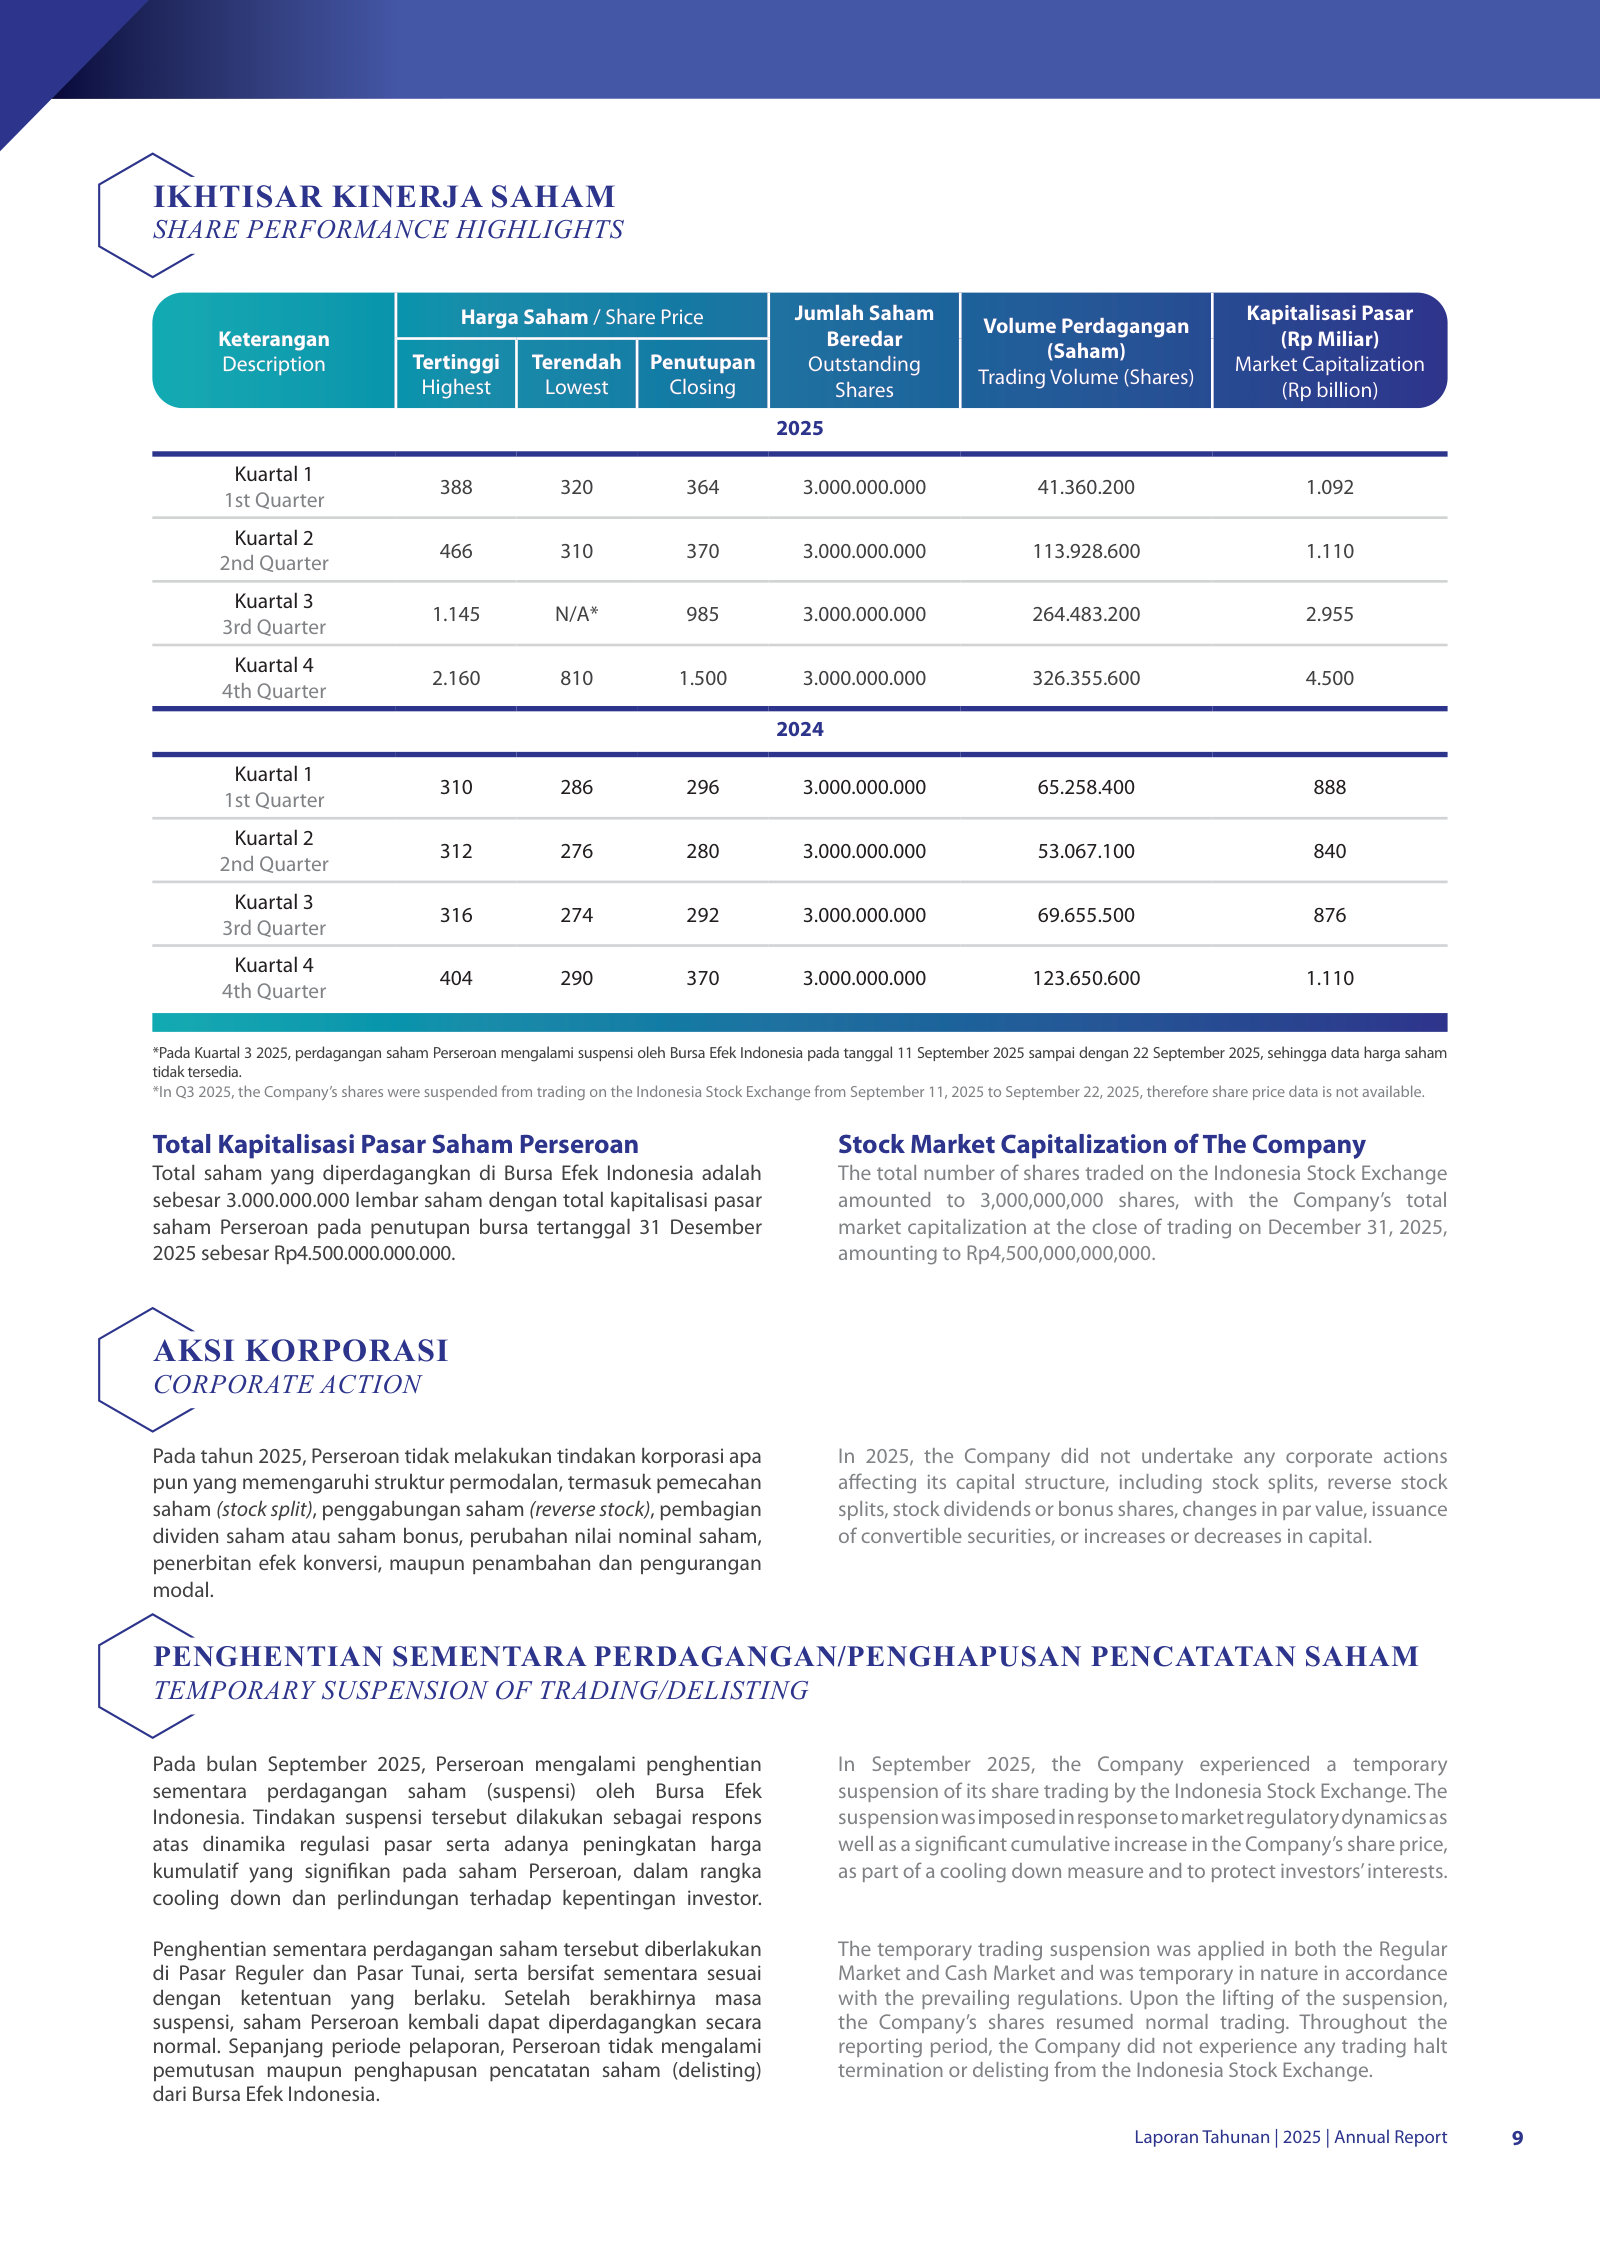
For most of its listed life PBSA traded as a sleepy micro-cap, with quarter-end closes between $0.017 and $0.023 through 2024. In the second half of 2025 the shares moved sharply: the fourth-quarter close reached $0.090 [16], and the exchange suspended trading for eleven days in September 2025 [17]. With a public float near 16% and no corporate development to account for it, the move looks like a thin-float re-rating rather than a change in the business. The full price round-trip, buyback and suspension are covered in Capital and Control.
Sources: quarter-end closes FY2024–FY2025 from the FY2025 Annual Report [18], converted at period-end FX; the July 2026 price is the latest market quote.
By 24 July 2026 the shares had fallen back to $0.043, roughly where a fundamental investor might start. No sell-side analyst covers PBSA, so there is no consensus to anchor to. At $0.043 the market values the equity near $130m, or about 7 times FY2025 earnings and 2.5 times book — cheap on trailing figures, but those figures include the portfolio gains discussed above, and the "earnings" they capitalize are partly a mark-to-market opinion.
The question this report answers
PBSA presents a genuine puzzle. It is a debt-free, cash-rich, high-return contractor trading at a single-digit trailing multiple with no analyst coverage — the profile value investors hunt for. It is also a contractor whose revenue depends on one industrial group's capex cycle, whose reported cash lags reported profit in the years they diverge, and whose record earnings have been lifted roughly a third by unrealized gains on a securities book that quadrupled in a year.
So the question the chapters that follow are built to answer is this: whether PBSA's record FY2024–25 profits represent a durable, repeatable construction franchise worth its modest multiple — or a lumpy, customer-concentrated contractor whose headline earnings have been flattered to record levels by unrealized portfolio gains, leaving a buyer paying for profit that construction alone did not earn. Everything that follows tests one side of that question or the other.
Figures converted from Indonesian rupiah at historical FX rates — see data/company.json.fx_rates. Ratios, margins, and multiples are unitless and unchanged.
Earnings Quality
Over FY2023–FY2025, roughly a third of PBSA's record pretax profit came not from building things but from investment results: a one-time $10.7M stake sale in 2023, then growing marks on a fund portfolio that reached $19.7M. FY2025's $6.7M fair-value gain — 31% of pretax — is an unrealized, non-cash mark on Nusadana-managed funds. Strip the investment line and construction-only earnings per share is about $0.0041, against the reported $0.0064 [1].
The chapter Two Profit Engines named the second engine. This one takes it apart: what the investment income actually is, how much of it is cash, how much is taxed, and what the construction business earns on its own.
The gap between operating and reported profit
For most of PBSA's listed history, operating income and pretax profit tracked each other closely — the company earned what it built. That link broke in FY2023 and has not been restored. In FY2023, pretax profit of $15.8M was more than double the $7.2M the construction operation produced; in FY2025, operating income of $14.6M carried up to a pretax figure of $21.7M [2].
Source: consolidated income statements as reported; FY2023 per Annual Report 2023 [3] and FY2024–FY2025 per Annual Report 2025 [4]; FY2019–FY2022 from company filings.
The wedge between the two bars is non-operating income, and it is almost entirely investment income. It was 54% of pretax profit in FY2023, 21% in FY2024, and 33% in FY2025. Summed across the three years, investment results delivered about $18M of a cumulative $52M of pretax profit — a third of the total — in a business whose reported story is construction for the palm-oil industry.
Two different investment engines
The label "investment income" hides two very different things, and the distinction is the heart of the earnings-quality question.
FY2023 — a real, cash, taxed windfall. The $10.7M "gain on sale of investments" that dominated FY2023 was the disposal of PBSA's 10% stake in PT EcoOils Jaya Indonesia, a palm-oil-linked venture it had built up from 2018. It sold the entire 24,000-share holding in October 2023 for USD 13.75mn [5]. This was a genuine, arm's-length cash exit that multiplied the original outlay several times over — a well-executed strategic investment. It was also taxed like one: FY2023 income tax jumped to $2.5M, from near zero a year earlier [6]. In the same year, the separate trading portfolio actually lost $2.5M on fair-value marks [7]. The windfall was real; it was also, by definition, not repeatable.
FY2024–FY2025 — unrealized marks on a fund book. What replaced the EcoOils gain is different in kind. The $6.7M that supplied 31% of FY2025 pretax profit is a "gain on fair value change on investments" — an unrealized mark-to-value adjustment on a held-for-trading portfolio, recognized in profit whether or not anything is sold [8]. Realized gains on actual sales were only $0.3M [9]. Ninety-five percent of the FY2025 investment result never touched a buyer.
Source: FY2023 income statement [10] and FY2025 income statement [11]. FY2023 realized gain is the EcoOils stake sale.
What the portfolio holds, and how it is valued
The short-term investment line grew from $5.5M to $19.7M during FY2025 and now equals 23% of total assets [12]. All but $0.05M of it is mutual-fund units and a discretionary managed account, valued at manager-reported net asset value per unit rather than exchange-quoted prices. Only one holding — a $0.05M stake in PT Indah Kiat Pulp and Paper — carries a market share price [13].
Source: FY2025 Annual Report, Note 11 Short-Term Investments [14].
Two features of this book deserve a professional reader's attention.
First, the marks are large and are set on units the company already owned. KPD Nusadana — a Kontrak Pengelolaan Dana, a bilateral discretionary managed-account mandate rather than a publicly traded fund — was carried at $0.055 per unit at end-2024 and $0.152 per unit at end-2025, a 187% rise, on an unchanged 46,255,167 units [15]. Juara Capital's unit value rose 133% over the same year. Nearly a third of pretax profit rests on the NAVs assigned to these vehicles.
Second, the manager. Three of the four funds — Nusadana Fixed Income, KPD Nusadana, and Nusadana Balanced Fund — carry the Nusadana name and together hold $16.3M, or 83% of the portfolio [16]. Two of PBSA's own board members held senior positions at Nusadana group entities: Director Evelyn Tanuwidjaja was Finance Director of PT Nusadana Capital Indonesia [17], and President Commissioner Halim Susanto was President Director of PT OSK Nusadana Securities Indonesia and President Commissioner of PT Nusadana Capital Indonesia [18]. The company discloses these holdings as third-party, and the board roles ended over a decade ago, so this is not a disclosed related-party transaction. But when the funds setting a third of reported profit share a name with vehicles two directors once ran, an investor is entitled to ask how independent the NAVs that drive earnings really are.
Cash and tax: the paper gains are both
For all the weight the fair-value line carries in profit, it is absent from cash flow — and that cuts both ways.
FY2025 operating cash flow was a strong $22.0M, built from $102.9M of cash collected from construction customers, which exceeded the year's revenue as receivables were drawn down [19]. None of that came from the portfolio. On the contrary, PBSA was a net buyer, placing $7.3M of fresh cash into short-term investments during the year [20]. So the reassuring part: FY2025's construction core genuinely converted to cash, and the year's large $9.9M dividend was funded by operations, not by liquidating the fund book. The uncomfortable part: the $6.7M that lifted headline profit is money the company has not received and, on current behaviour, is not trying to receive.
The prior year shows the same point from the other side. In FY2024, PBSA reported $13.3M of net profit but operating cash flow of negative $2.7M as working capital absorbed cash [21]. Reported earnings and cash have diverged sharply in both directions.
Tax tells a parallel story. Because the FY2025 fair-value gain is unrealized, it is untaxed: the income statement carries a $2.4M final tax levied on construction revenue and only $0.07M of income tax, against $21.7M of pretax profit [22]. That is not aggressive accounting — it is how Indonesia taxes construction revenue and unrealized gains. But it means the $6.7M mark carries an unbooked tax cost on the day it is realized. The scale of that cost is not hypothetical: in FY2024, when PBSA did harvest part of the book, it paid $2.4M of cash tax on investment sales [23].
Construction-only earnings
Removing the investment result leaves what the contracting business earns on its own. Stripping the unrealized fair-value gain and the small realized gain from FY2025 net profit takes $19.2M down to about $12.2M, and reported EPS of $0.0064 down to roughly $0.0041 [24].
Reported FY2025 EPS ($)
Fund portfolio ($M)
Construction-only EPS ($)
Source: derived from FY2025 reported income statement; investment gains per Note 11 [25].
Source: FY2025 Annual Report, income statement and Note 11 [26] [27].
Construction-only EPS of about $0.0041 is still a record for the company and still cash-backed, so this is not a case of a hollow business dressed up by a portfolio. It is a case of a headline number that overstates the repeatable one by roughly a third. A valuation multiple placed on $0.0064 is a very different thing from the same multiple placed on $0.0041.
Two caveats keep this measure honest. The construction line itself rests on percentage-of-completion revenue, which PBSA's auditor flags as a Key Audit Matter every year — earned-but-unbilled contract assets and retention receivables together stood at $17.3M at end-2025 [28] [29]. And the investment gains, while low-quality as earnings, are not fictitious: the FY2023 EcoOils exit proves the company can turn an investment into real cash, and FY2025's construction cash collection was strong.
What would change the read
The investment income is genuine profit under the accounting rules and has, at least once, become genuine cash. The concern is quality, not existence: a third of the record depends on unrealized marks, concentrated in Nusadana-managed vehicles, that would swing back through the income statement in a down year exactly as they swung up — FY2023's $2.5M fair-value loss is the reminder. The read would ease if PBSA redeems a meaningful slice of the fund book at or above carrying value, or discloses the funds' underlying holdings and valuation basis; it would harden if the marks keep climbing without redemptions, or if a weak year reveals how much of the NAV was ever realizable. For any forward estimate, the construction-only figure — near $0.0041 of EPS — is the more defensible base, with the portfolio treated as a separate, volatile asset rather than an earnings stream.
Figures converted from Indonesian rupiah (IDR) at historical FX rates — see data/company.json.fx_rates. Ratios, margins, and multiples are unitless and unchanged.
Palm Oil Capex
PBSA's construction business is a real and growing franchise, but its reported profit and its operating result are no longer the same number, and the most recent quarter shows the gap at its widest. In Q1 FY2026 PBSA's construction-driven operating income grew 59.8% to $4.56M, yet net profit fell 94% to $0.08M because the investment portfolio swung to an unrealized fair-value loss of $4.0M. Both the operating and net lines, and the swing between them, sit on a single income-statement page [1] [2]. This chapter reads the durable base beneath that headline — a construction contractor tied almost entirely to one industrial ecosystem — and how repeatable it is.
Is the durable engine the same as the reported number?
The wedge sits on one income-statement page. Operating income of $4.56M compares with $3.05M a year earlier, construction-driven growth of 59.8% [3]. Against that, the investment portfolio recorded an unrealized fair-value loss of $4.0M, which pulled the quarter's net profit down to $0.08M from $1.54M, a 94% fall [4]. The same portfolio that supplied roughly a third of FY2025 pretax profit reversed within a single quarter and erased almost all of a period in which the core business grew nearly 60% at the operating line.
Source: Q1 FY2026 Interim Financial Statements, Statement of Profit or Loss [5].
The swing runs in both directions, and that is the point. It is unrealized and non-cash: it does not touch the cash the construction work generates, so the near-zero net profit understates the quarter's economic result just as FY2025's positive marks overstated the year's. For the durability question, the quarter shows that the construction franchise and the reported bottom line are not the same thing — the engine repeated and compounded while the headline was driven by the securities book.
The construction engine is real, and it is growing
Earlier chapters separated PBSA's two profit sources (Two Profit Engines) and stripped the investment marks out of headline profit (Earnings Quality), leaving a construction-only base of roughly $12.2M net and about $0.004 EPS. The first question for durability is whether that base is itself growing or stalling. It is growing.
Source: FY2022 Annual Report, Management Discussion and Analysis [6] (FY2021–FY2022); FY2024 Annual Report, Management Discussion and Analysis [7] (FY2023); FY2025 Annual Report, Management Discussion and Analysis [8] (FY2024–FY2025).
Revenue climbed 162% in FY2022 to $47.6M [9], fell back to $37.2M in FY2023 [10], then doubled again — up 101.5% in FY2024 to $71.6M [11] and a further 37.85% in FY2025 to $95.5M [12]. The path is not smooth — a doubling, a 22% fall, then two years of surge — which is the signature of a project contractor whose top line moves with the timing of a handful of large jobs rather than a steady book of recurring work.
FY2025 Revenue ($M)
Construction ($M)
Construction Share
Source: FY2025 Annual Report, Business Segment Overview [13].
Construction is 91.6% of FY2025 revenue at $87.5M; a trading segment (project-material supply) adds $8.0M and building management is negligible [14]. The company is, in substance, a single-line industrial-construction contractor.
One ecosystem: the customers and the order book
The concentration is not a matter of degree. For both FY2025 and FY2024, every customer whose cumulative billings individually exceeded 10% of revenue was a Sinar Mas / Golden Agri palm-oil entity: PT Sinar Mas Agro Resources and Technology (SMART), PT Soci Mas, PT Binasawit Abadipratama, PT Ivomas Tunggal, and PT Sumber Indah Perkasa [15]. There is no meaningful revenue line outside that group.
The order book says the same thing. PBSA does not publish a single backlog figure, but Note 34 of the FY2024 accounts lists every ongoing contract above roughly $0.6M — 17 of them, worth about $40M in aggregate. Grouped by owner, all of it is the palm-oil ecosystem:
Source: FY2024 Annual Report, Note 34 Significant Agreements and Commitments [16].
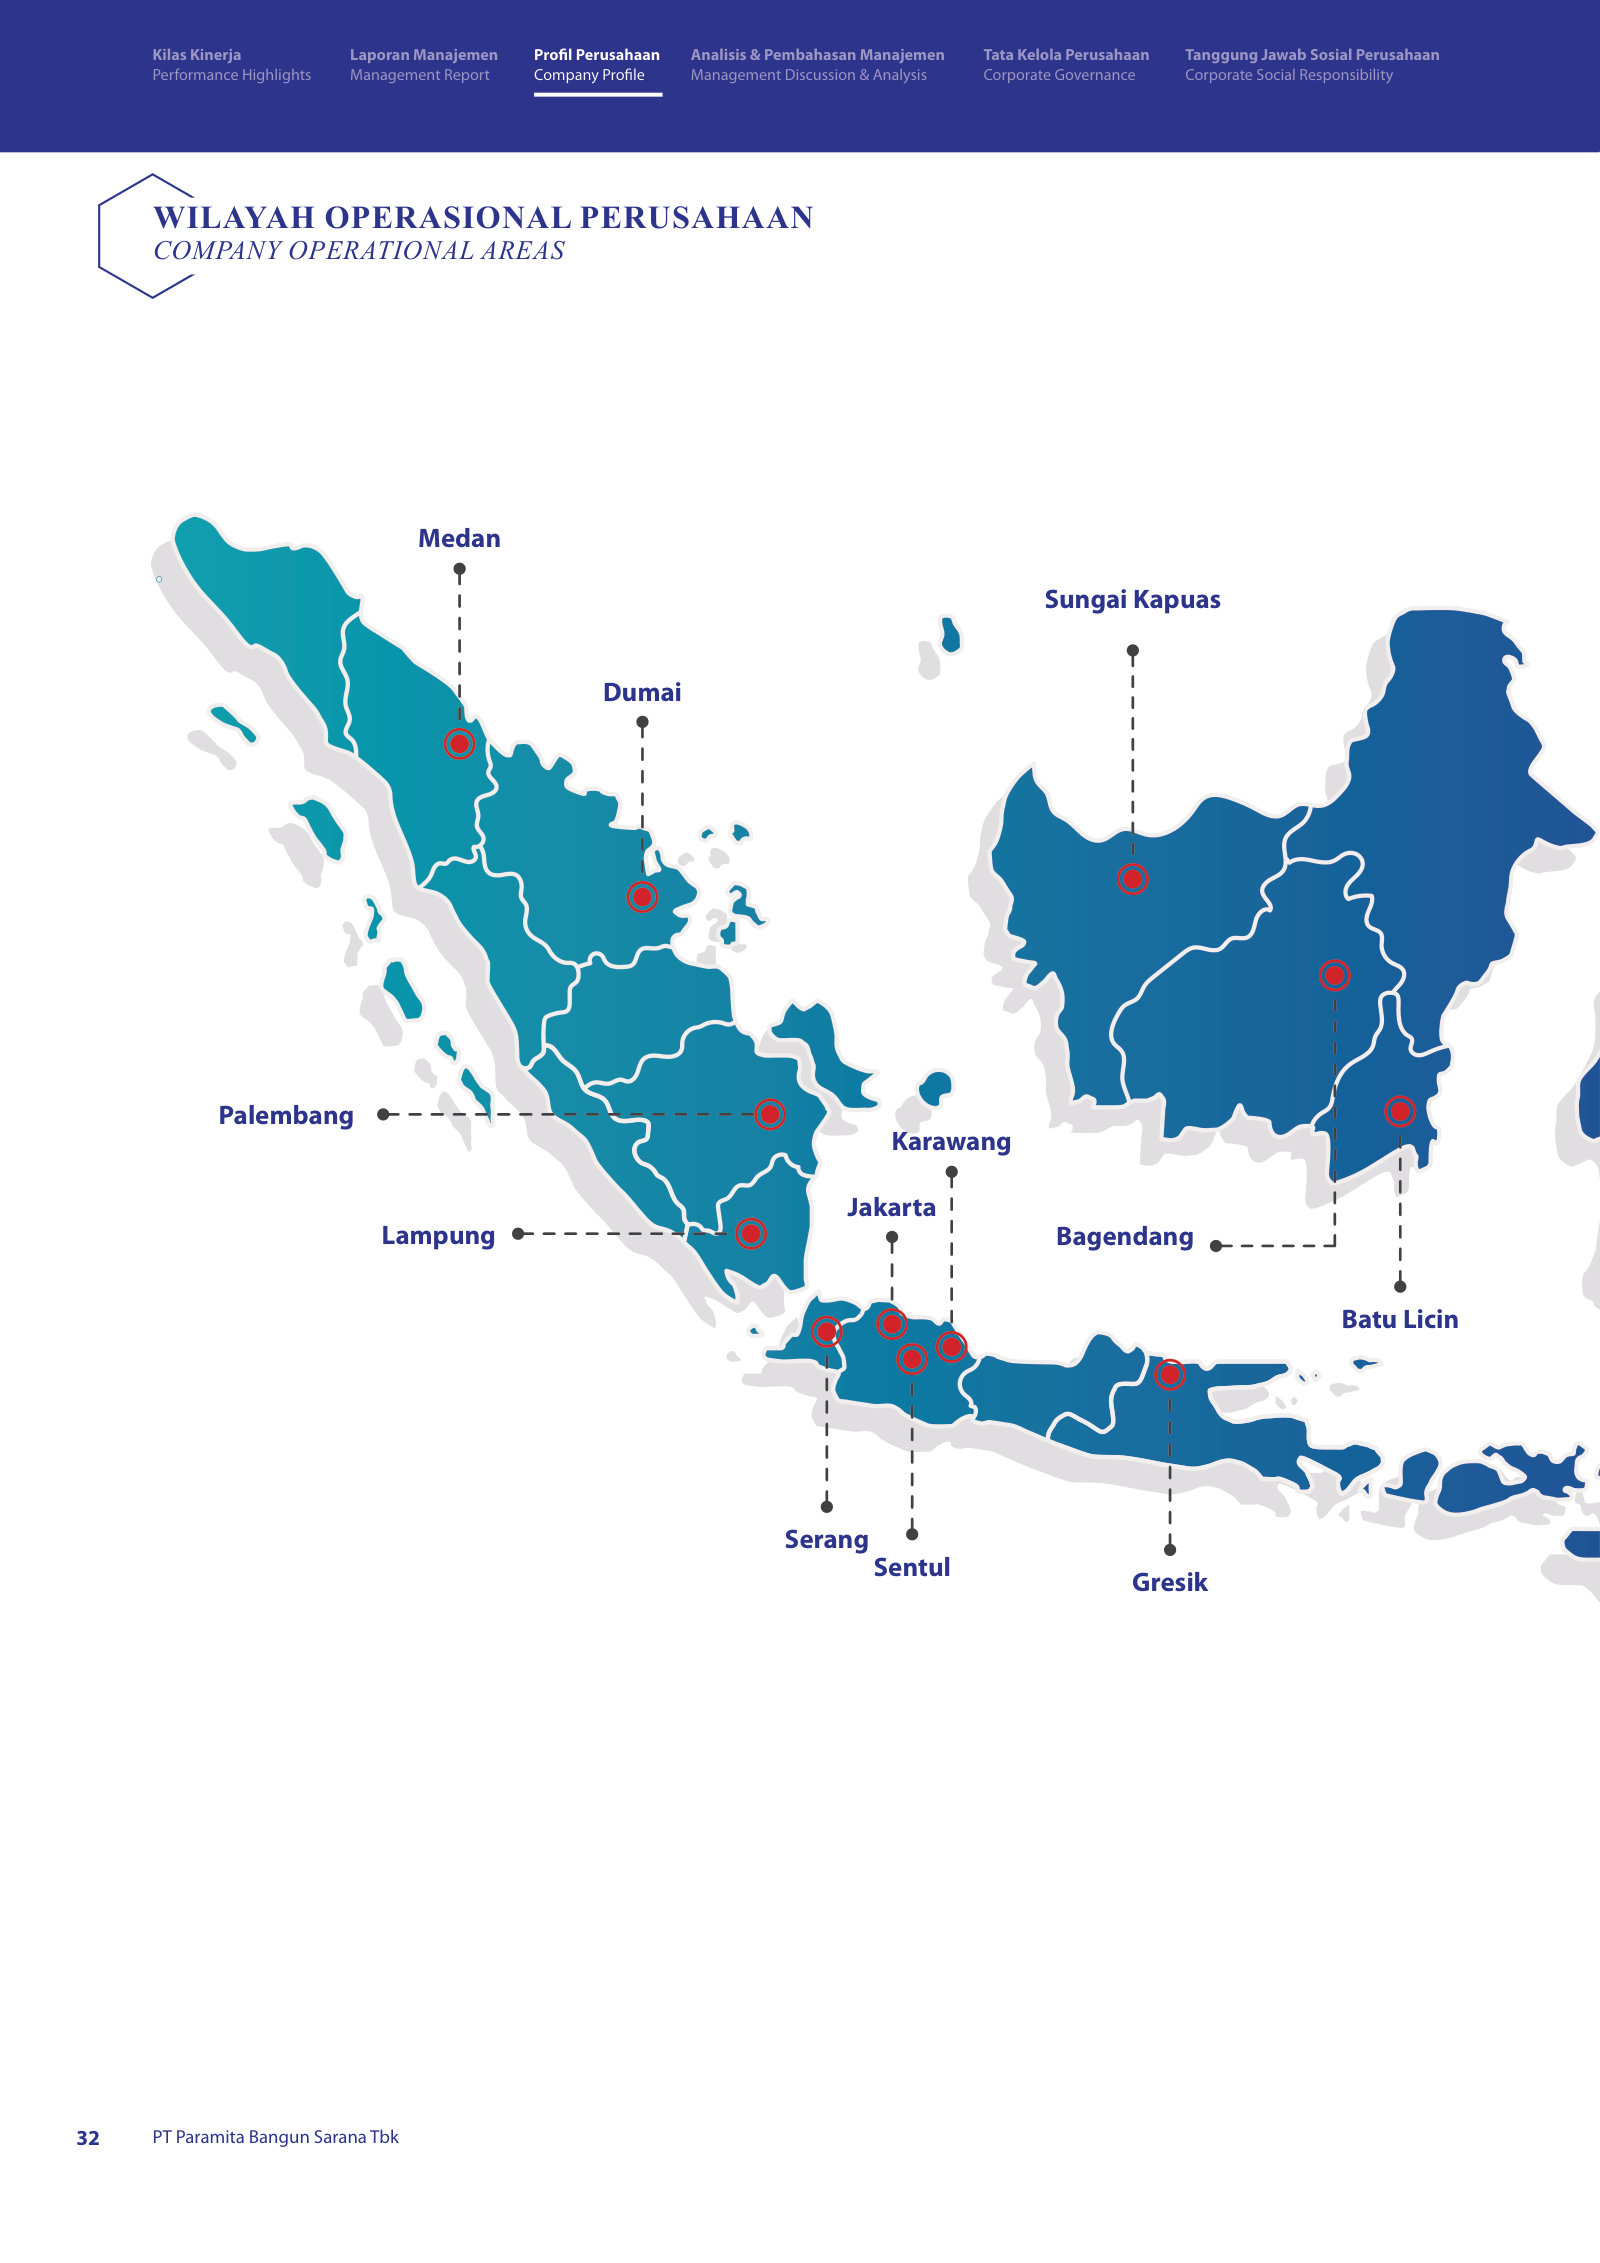
Every project is a palm-oil facility: upper-structure storage tanks at Lubuk Gaung and Lampung, a jetty and land grading at Bagendang, a refinery expansion at Marunda, palm-kernel-expeller warehouses at Dumai, a fractionation retrofit at Belawan [17]. The customers are the anchor tenants of Indonesia's palm-oil supply chain, and PBSA builds the tanks, terminals, and refineries they need to process and move the oil.
Source: FY2024 Annual Report, Note 34 Significant Agreements and Commitments [18].
Two features of this book matter as much as its concentration. First, it is short-dated: every contract listed at end-2024 matured within 2025, and the six contracts disclosed a year later all mature during 2026 [19]. There is no multi-year backlog cushioning revenue; the book turns over roughly annually, which is why the top line can double or fall by a fifth from one year to the next. Second, the disclosure itself thinned: the FY2024 note reported 17 contracts above roughly $0.6M with values attached, while the FY2025 note reports only six above roughly $1.8M and drops the contract values [20]. A reader loses the ability to size forward work precisely at exactly the point the numbers grew largest.
What sustains the demand, and what could refill it
The work is tied to a specific capital cycle. Management frames its own demand as the government's hilirisasi (downstream-industrialisation) push, which pulls palm-oil processing onshore and drives construction of refineries and their supporting infrastructure [21]. The FY2025 growth is attributed directly to "increased demand for the development and procurement of palm oil mill facilities" [22]. That cycle — refining, fractionation, and bulking capacity built out to feed export demand and Indonesia's rising biodiesel blending mandate — is real and, for now, expanding. It is also outside PBSA's control: it turns on palm-oil economics and one group's investment appetite, neither of which the company influences.
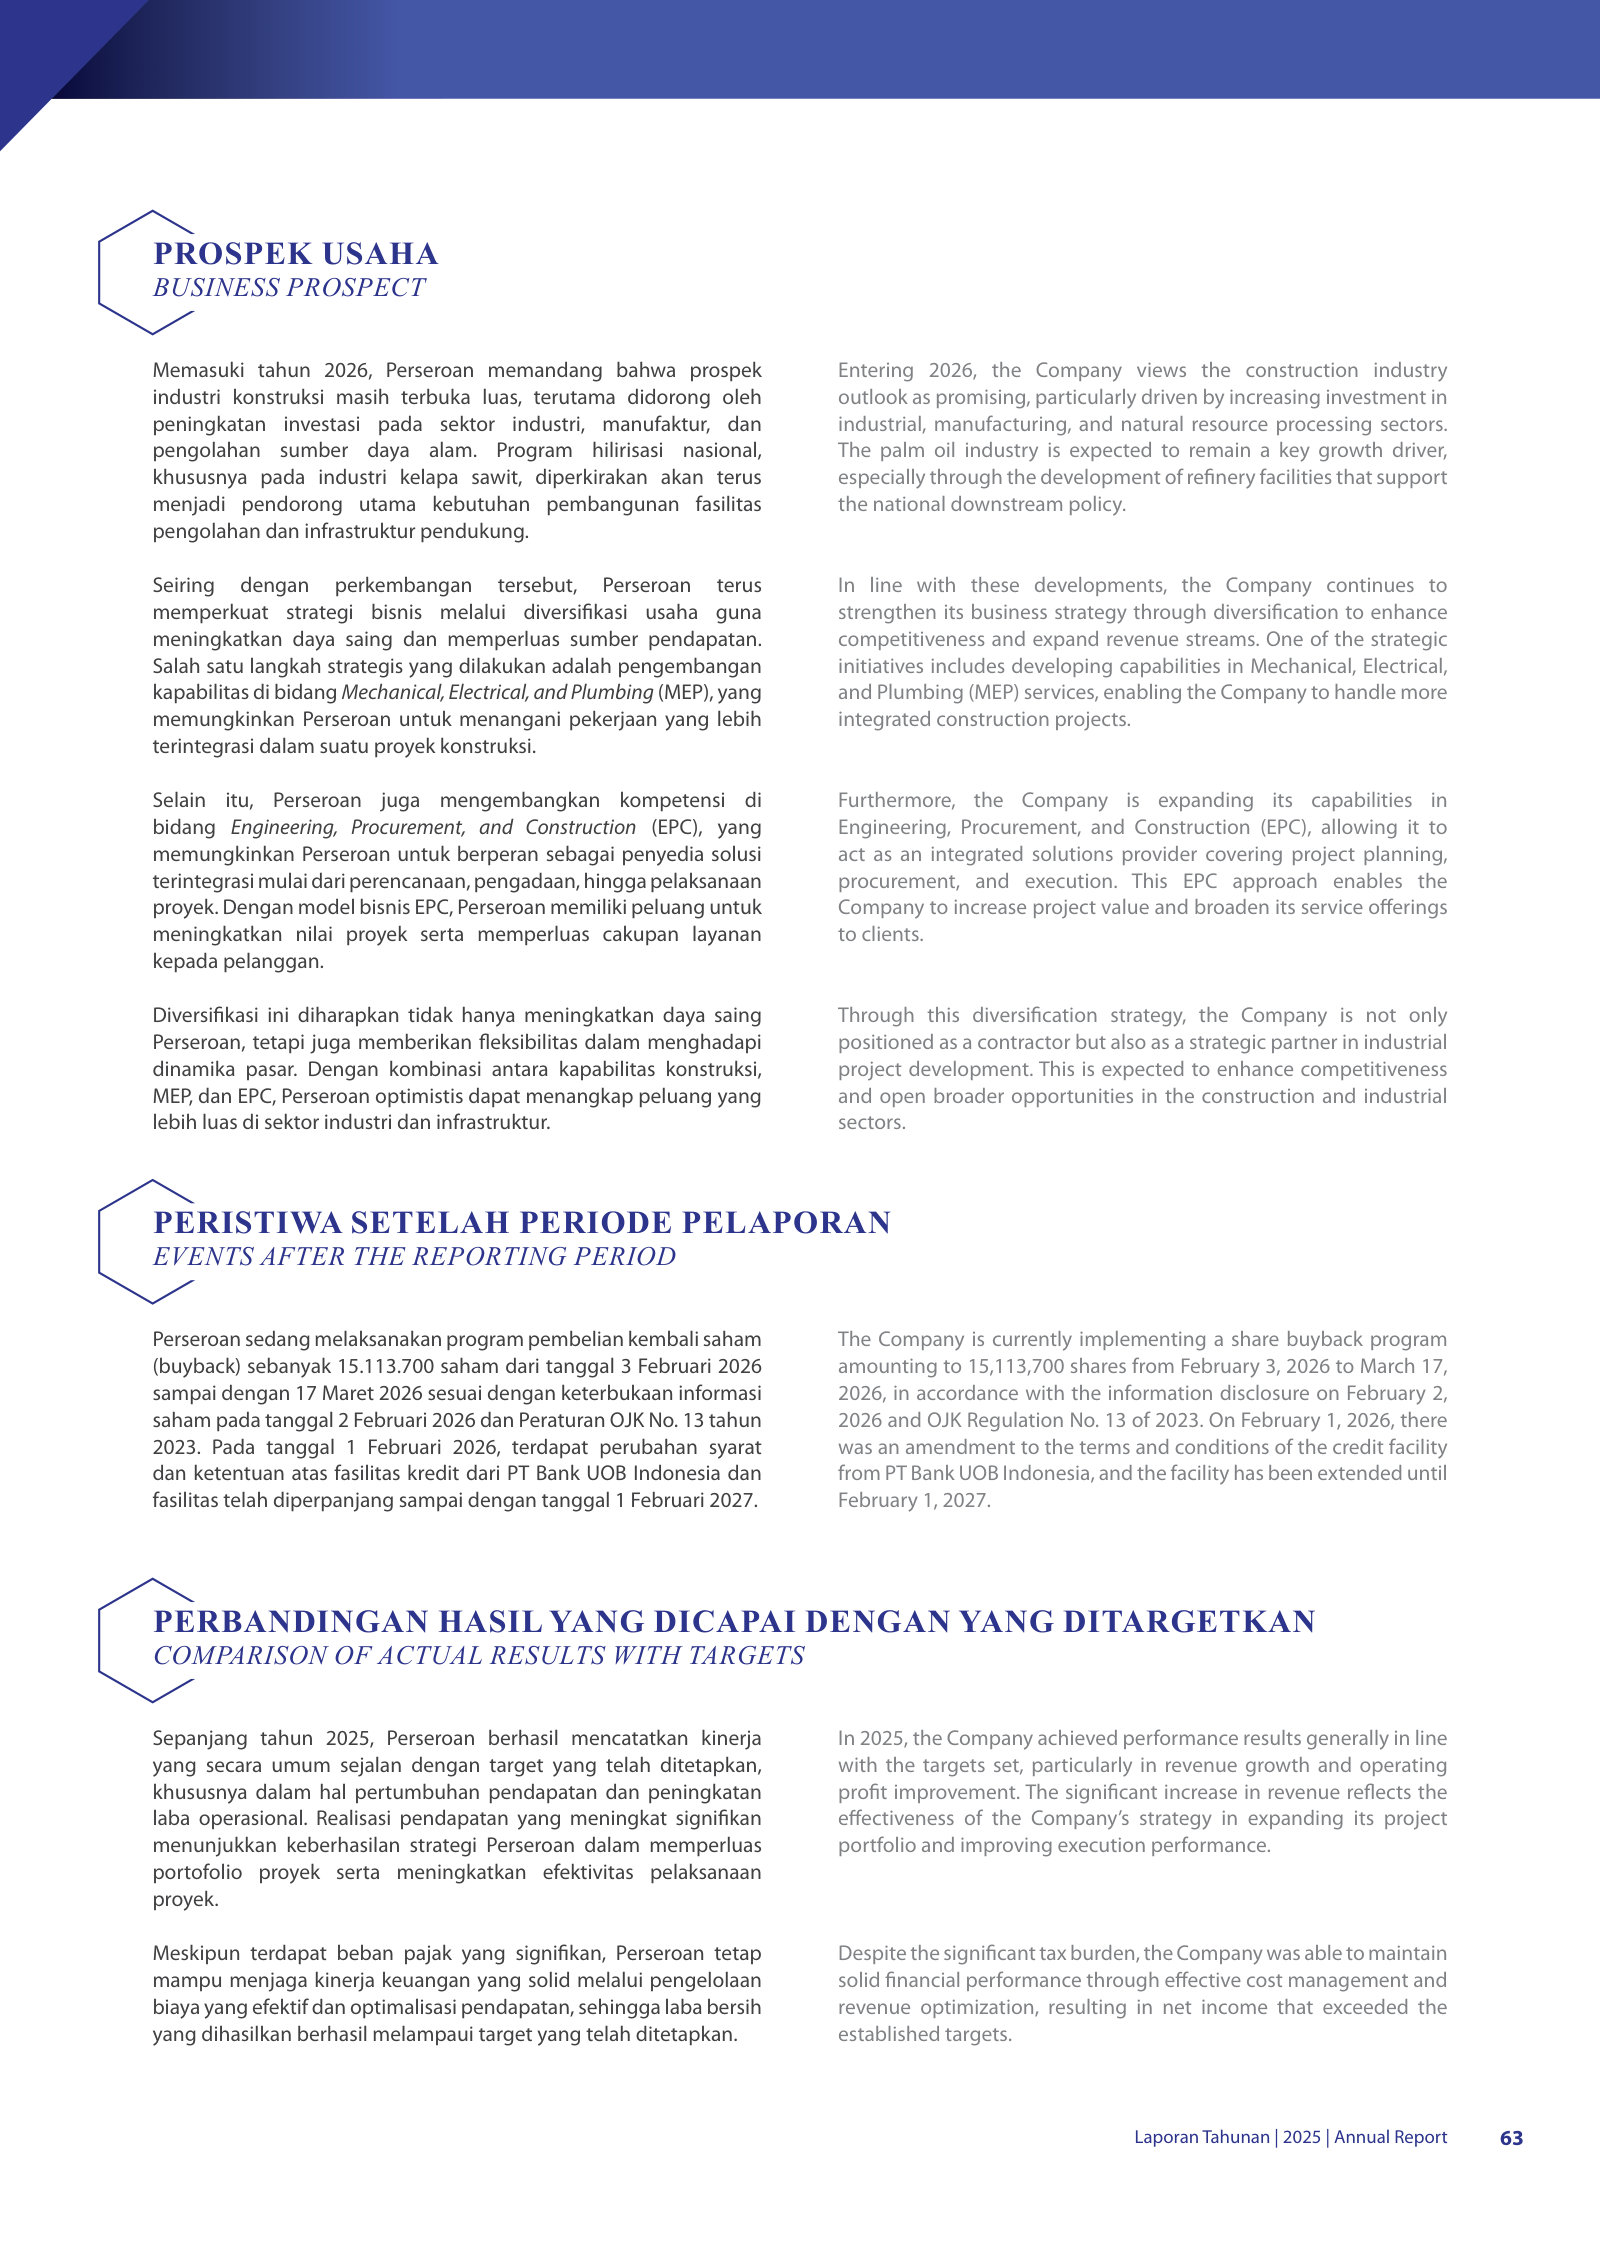
Management's stated answer to the concentration is diversification — targeting new contracts in industrial estates, manufacturing, and energy, and building out Mechanical/Electrical/Plumbing and Engineering-Procurement-Construction (EPC) lines to widen the addressable work and lift project values [23]. The intent is credible but unproven in the numbers: the trading and building-management segments remain small, and even the nearest thing to a non-palm customer in the current book — an IKK building-expansion job for PT Indah Kiat Pulp and Paper — sits inside the same Sinar Mas group [24]. Diversification is a plan, not yet a fact.
What would change the read
The measured view: PBSA runs a genuine, growing, cash-generative construction franchise, but its durability rests on the continued downstream investment of the Sinar Mas / Golden Agri complex, and its reported earnings will stay volatile as long as a large trading portfolio sits on top of it. The strongest fact for the bulls is the operating record — two years of surging revenue and a 60% jump in Q1 FY2026 operating income show the ecosystem is still building and PBSA is still winning the work, plausibly a trusted-vendor position a decade in the making. The strongest fact against is that none of this is diversified: a pause in palm-oil downstream capex, or a decision by the group to use another contractor, would hit revenue with roughly annual notice and no backlog cushion.
Three things would move the read. A first material contract from a customer outside the Sinar Mas / Golden Agri ecosystem — energy, industrial estates, or third-party EPC — would begin to convert the diversification plan into fact. A lengthening of the order book beyond its current ~12-month horizon would reduce the revenue lumpiness that has defined the last decade. And a sustained downturn in CPO economics or a stall in Indonesia's downstream build-out would signal that demand is fading. Until one of those appears, the construction business should be read as real but singular: repeatable only for as long as one group keeps investing.
Figures converted from Indonesian rupiah at historical FX rates — see data/company.json.fx_rates. Ratios, margins, and multiples are unitless and unchanged.
Family and Funds
The unrealized marks that supply roughly a third of PBSA's pretax profit sit almost entirely in funds carrying the Nusadana name — and the people who ultimately own PBSA, and who sign its accounts, personally ran the Nusadana investment group before joining the company. PBSA discloses the $19.7M portfolio as a third-party holding, and the historical roles ended between 2008 and 2013. But ownership of the company and the valuation of those funds run through the same few people, which the "third party" label alone does not convey.
Who ultimately owns PBSA
Two private holding companies own 83.72% of PBSA: PT Ascend Bangun Persada (46.16%) and PT Sigma Mutiara (37.56%), with a 16.28% public float [1]. The FY2025 annual report names the ultimate beneficial owners plainly: Erwin Tanuwidjaja and Yonggi Tanuwidjaja [2].
The 2016 IPO prospectus shows the chain in full. At listing, PT Ascend Bangun Persada was owned 85% by Yonggi Tanuwidjaja and 15% by Halim Susanto; PT Sigma Mutiara was held entirely by the Tanuwidjaja family and their vehicles — Inge Setyawati Tanuwidjaja, Erwin Tanuwidjaja, Yonggi Tanuwidjaja, PT Paramita Adhi Perkasa and PT Nuansa Indah Kreasi (itself 98% Yonggi Tanuwidjaja) [3]. By FY2025 an intermediate vehicle, PT Infiniti Investama (98.67% Halim Susanto), had been inserted above Ascend, but the beneficial ownership remained the same family group [4]. This is the ownership that directs both the dividend and the securities book examined in Capital and Control.
The same hands ran the fund manager
The distinctive fact is not the ownership concentration — Capital and Control covered that — but where these same individuals worked before PBSA. The company's own board biographies disclose it:
Sources: FY2025 Annual Report, Board of Directors profile [5] and Board of Commissioners profile [6]; 2016 IPO Prospectus, management profiles [7].
Yonggi Tanuwidjaja — one of the two named ultimate owners — was President Director of PT Nusadana Capital Indonesia from 2005 to 2008 and a commissioner of the affiliated securities house [8]. Evelyn Tanuwidjaja, PBSA's Finance Director and a family affiliate of the ultimate owners, was Finance Director of the same Nusadana Capital entity [9]. Halim Susanto, the President Commissioner, ran the OSK Nusadana securities business and chaired the Nusadana Capital board [10]. The finance director who signs off on the portfolio's carrying value, in other words, came from the manager of the funds that dominate it.
Where the money actually sits
At 31 December 2025 the $19.7M short-term investment book was 82.9% concentrated in three Nusadana-branded funds, with a fourth manager-run fund (Juara Capital) taking most of the rest. Only $0.05M — a single listed share, PT Indah Kiat Pulp and Paper — carried an observable exchange price. The other 99.7% is valued at net asset values published by the fund managers themselves [11].
Source: FY2025 Annual Report, Note 11 Short-term Investments (holdings as at 31 Dec 2025) [12].
The valuation basis matters because the marks move sharply. KPD Nusadana was carried at $0.152 per unit at end-2025 against $0.055 a year earlier — a 186.7% gain on an unchanged 46,255,167 units, lifting that single line from $2.5M to $7.0M without a dollar of new money [13]. The mechanics of that mark, and its weight in reported profit, are the subject of Earnings Quality; the point here is who published the number.
Nusadana-branded (% of portfolio)
Valued at manager NAV (%)
At observable market price (%)
Source: derived from FY2025 Annual Report, Note 11 ($16.3M of $19.7M Nusadana-branded; $0.05M at an exchange price) [14].
What the "third party" label does and does not settle
PBSA classifies the entire portfolio as a third-party holding, and the funds appear nowhere in the related-party note (Note 30), which lists only key-management compensation of $0.25M [15]. The units are held through independent custodian banks — PT Bank Danamon and Bank BJB — not by a connected entity [16]. The disclosed Nusadana roles all ended more than a decade ago, and nothing in the corpus shows the family currently owns or controls the funds' manager. On the evidence available, this is not proven related-party dealing.
What it is: a concentration of trust that the accounting treatment obscures. A third of pretax profit, and about 35% of equity, rests on net asset values published by an investment group that three of PBSA's senior insiders — including a named ultimate owner and the sitting finance director — once ran, and those values are self-certified rather than struck against a market. A genuinely arm's-length third party and a former employer are both "third parties" in the note; only one of them raises the question of whether the mark and the marker are independent.
The reading that would flip this from a governance flag to a related-party finding is direct evidence that the Tanuwidjaja or Susanto interests currently hold or control the Nusadana fund manager — a registry fact the filings do not carry and this run could not retrieve. The reading that would defuse it is a clean redemption: units sold to the custodian bank at the carried NAV, converting a manager's mark into cash. Q1 FY2026 offered a partial, unhelpful test — the portfolio was marked down $4.0M in a single quarter, and $2.8M was sold to bridge a cash shortfall (Sum-of-the-Parts) — which shows the marks are at least two-directional, but not that the up-marks clear at book. Until a redemption does, the safest treatment is to value the Nusadana stack at a discount to its published NAV, exactly as Sum-of-the-Parts does when it strips the portfolio out of the construction valuation.
Nusadana Manager
Figures converted from Indonesian rupiah at historical FX rates — see data/company.json.fx_rates. Ratios, margins, and multiples are unitless and unchanged.
The investment manager that sets the value of 82.9% of PBSA's $19.7m securities book — the source of roughly a third of pretax profit — carries the Nusadana name that recurs through PBSA's ownership history (Family and Funds). An external, OJK-registered prospectus for one of the manager's funds names PBSA and both companies that control PBSA as affiliated parties, and lists PBSA's ultimate owner as chair of the manager's investment committee. That prospectus is not in this report's corpus, and the run could not independently verify it against PBSA's filings or a company registry. What the filings do show is that PBSA books these Nusadana holdings as third-party and lists no fund in its related-party note. If the prospectus is accurate, the third-party label is difficult to sustain; on the corpus alone, the concentration and the manager-set valuations are a governance flag rather than a proven affiliation — one Sum-of-the-Parts already reflects by discounting the marks.
What PBSA reports
At 31 December 2025 PBSA carried $19.7m of short-term investments, of which $16.3m — 82.9% — sat in three funds bearing the Nusadana name: Nusadana Fixed Income ($7.4m), the KPD Nusadana discretionary mandate ($7.0m) and Nusadana Balanced Fund ($1.8m). The note books every unit of it under the heading "Pihak ketiga / Third parties," and the year's change in fair value — a $6.7m gain — flows straight to the 2025 income statement [1]. The related-party note discloses only one relationship: $0.25m of key-management compensation. No fund, and no fund manager, appears there [2]. On PBSA's own telling, the manager marking a third of its profit is a stranger.
Whether that booking holds up is the subject of this chapter. The weight of the mark in earnings sits in Earnings Quality; the historical fact that PBSA's insiders once ran a Nusadana entity sits in Family and Funds, which left one question open — whether the family currently controls the manager, a registry fact the filings do not carry. An external prospectus appears to answer it, but this run could not retrieve or verify that fact against the corpus or a registry — the same limit Family and Funds and What to Watch record.
What the manager's prospectus discloses
The three Nusadana funds are run by PT Nusadana Investama Indonesia, an OJK-licensed investment manager (licence KEP-48/D.04/2017). The account that follows comes entirely from that manager's published prospectus for the Nusadana Lancar fund — a document outside this report's corpus that the run could not independently verify against a filing or registry. On its face it records two facts PBSA's accounts do not.
First, the manager's origin. It was incorporated on 11 January 2017 as PT Ascend Investama Indonesia, and renamed PT Nusadana Investama Indonesia on 15 March 2019; its flagship money-market fund was renamed in step, from "Ascend Dana Lancar" to "Nusadana Lancar." "Ascend" is the name PBSA's direct 46.16% controlling shareholder carries — PT Ascend Bangun Persada. The manager and PBSA's holding company were built under one brand.
Second, the prospectus lists the parties it regards as affiliated with the manager. In its section headed Pihak yang terafiliasi dengan Manajer Investasi, it states that the parties affiliated with the Investment Manager are PT Infiniti Investama Indonesia, PT Ascend Bangun Persada, PT Paramita Bangun Sarana Tbk (PBSA), PT Moladin Finance Indonesia and PT Supra Sekuritas Indonesia.
Three of those five names are PBSA and the two holding companies that own it. PT Ascend Bangun Persada holds 46.16% of PBSA directly; PT Infiniti Investama — 98.67% owned by PBSA's president commissioner, Halim Susanto — sits at the top of the control chain [3]. In a document filed with the securities regulator, the manager itself declares PBSA's entire control stack to be its affiliates. A fifth name closes the loop: PBSA holds its listed-share investments through fund accounts at PT Buana Capital and PT Supra Sekuritas Indonesia [4] — and Supra Sekuritas, too, is on the manager's affiliate list.
Sources: PT Nusadana Investama Indonesia — Nusadana Lancar fund prospectus (2024 update), Ch. III, Affiliated Parties of the Investment Manager (public OJK filing, nusadana.com); PBSA FY2025 Annual Report, Shareholding Structure [5] and Note 11 [6].
Overlapping principals
The same prospectus names individuals as well as entities. It lists Yonggi Tanuwidjaja as the manager's president commissioner (Komisaris Utama) and the chair of its investment committee — the body that directs and oversees how the funds are invested and valued. Yonggi Tanuwidjaja is one of the two ultimate beneficial owners the FY2025 annual report names for PBSA [7]. His bio in the same prospectus lists his other current posts: deputy president director of PT Ascend Bangun Persada (2013–present) and director of PT Sigma Mutiara (2016–present) — the two holding companies that between them control 83.7% of PBSA.
If the prospectus is accurate, one person therefore sits on both sides of the mark: a controlling owner of the company that holds the funds, and the chair of the committee at the manager that prices them. Independent of the prospectus, the corpus records an older overlap: Halim Susanto — PBSA's president commissioner and the owner of Infiniti at the top of the chain — ran the affiliated Nusadana securities house within the last decade [8].
Sources: PBSA FY2025 Annual Report, beneficial-ownership disclosure [9]; PT Nusadana Investama Indonesia — Nusadana Lancar fund prospectus (2024 update), Ch. II–III, Investment Committee and management (public OJK filing).
The manager depends on this relationship as much as PBSA depends on the marks. Its prospectus put total assets under management at about $32m at the end of January 2024; PBSA's Nusadana holdings stood at $16.3m by December 2025. The two dates are not directly comparable, and the later figure carries a large mark-up, but on any reading PBSA is among the manager's largest clients — and if the affiliation holds, the price-setter and its biggest customer share the same owners.
Why the label carries weight
Indonesian accounting standard PSAK 7 treats an entity as related when a person who controls or is a key manager of the reporting entity also controls, or is a key manager of, the other entity. If the prospectus is accurate, a controlling owner of PBSA chairing the manager's investment committee would meet that test on its face, and the prospectus reaches the same conclusion under the securities-law definition of an affiliate. PBSA nonetheless books the holdings as third-party and reports no related-party fund in Note 30. On the same relationship, the issuer's accounts and the external prospectus disagree — and this run could not settle which is right against a registry.
The disagreement matters because of how the number is struck. Of the $19.7m book, only $0.05m — a single listed share — carries an observable exchange price; the other 99.7% is valued at net asset values published by the managers [10]. The mechanics of those marks — including a single KPD discretionary mandate revalued 186.7% in one year — are set out in Earnings Quality and their bearing on the family's holdings in Family and Funds; what matters here is that the prices carrying a third of PBSA's pretax profit are struck by the manager, not by a market.
Two facts cut the other way, and both belong in the read. The units are held through independent custodian banks — PT Bank Danamon and Bank BJB — not by the manager or a connected custodian [11], so the assets themselves are ring-fenced even where the price is not. And the marks move in both directions: the same portfolio was written down about $4.2m in the quarter to 31 March 2026, so the NAVs are not a one-way ratchet (Sum-of-the-Parts). What the affiliation would change is not whether the assets exist but who certifies their value: a third of PBSA's pretax profit rests on prices set by the manager, and the external prospectus, if accurate, would make that manager a related party rather than an arm's-length one.
The read: on the corpus alone, PBSA's own accounts and an external prospectus disagree on whether the manager is a related party, and this run could not settle that against a registry. Taken as a governance flag — 82.9% of the securities book in Nusadana-branded funds, 99.7% of the book marked to manager-published NAV, an ultimate owner with a documented past role at a Nusadana entity and, per the prospectus, a current one at the manager — the $6.7m of fair-value gains is better read as manager-influenced marks worth a discount to published NAV, as Sum-of-the-Parts already applies. Two developments would retire the concern: a cash redemption of the Nusadana units at or near their carried NAV, converting the manager's opinion into money; or a restatement that moves the funds into the related-party note. If instead the prospectus were shown inaccurate or superseded, the third-party label would stand and the flag would fall back to the ordinary concentration risk of a large, self-directed portfolio.
Capital and Control
Figures converted from Indonesian rupiah at historical FX rates — see data/company.json.fx_rates. Ratios, margins, and multiples are unitless and unchanged.
PBSA returns most of its construction cash to shareholders — a dividend every year, payout ratios of 77–90% of profit, and a per-share payment that has climbed from $0.0026 to $0.0036. But the cash flows to a control block that owns 83.7%, and the board that directs both the payout and the $19.7M securities portfolio has one independent member out of five. The capital-return record is real and cash-backed; control over how that cash is used is close to absolute.
A high, rising, cash-backed dividend
PBSA has paid a cash dividend in every year of its listed life, and has raised the per-share amount steadily as profits grew. The company's own record shows dividends paid in 2023, 2024 and 2025 of $7.8M, $10.3M and $9.9M — $0.0026, $0.0034 and $0.0033 per share — representing 89.6%, 82.5% and 76.7% of the prior year's net income [1]. The FY2024 profit was distributed as $9.9M, or $0.0033 per share, at a 76.73% payout ratio approved at the June 2025 AGM and paid on 17 July 2025 [2].
Sources: dividend totals and per-share amounts, FY2025 Annual Report Note 25 [3]; FY2025 dividend of $0.0036/share per the June 2026 declaration [4]; net income per reported financials [5].
The FY2023 dividend of $10.3M ($0.0034 per share) was itself split into a $7.8M interim paid in December 2023 and a $2.4M final paid in July 2024; the FY2024 dividend of $9.9M followed in July 2025 [6]. This is not new behaviour reaching back only to the profit surge: the company paid $1.4M, $3.5M and $2.8M in 2019–2021, at a time when annual profit was a fraction of today's [7]. The dividend is funded by construction cash, not the portfolio: as the Earnings Quality chapter established, FY2025 operating cash flow of $22.0M came entirely from construction collections, comfortably covering the payout.
The FY2025 payout is sized to construction profit, not the headline
The FY2025 declaration reflects that discipline. Against reported FY2025 net profit of $19.2M — a record, and reported earnings per share of $0.0064 [8] — the board declared a dividend of $10.8M, or $0.0036 per share, a payout ratio of 55.95% [9]. That is the lowest ratio in the series, and on its face it looks like a retreat from the 77–90% payouts of prior years.
It is not. The FY2025 headline carried a $6.7M unrealized fair-value gain on the securities portfolio — roughly a third of pretax profit — which the Earnings Quality chapter stripped out to leave a construction-only profit of about $12.2M. Measured against that durable base, the $10.8M dividend is an ~89% payout, squarely inside the historical band. The board sized the distribution to what construction earned and left the paper gains on the balance sheet. In sizing the dividend to construction earnings, management treated the marks as non-distributable.
Where the surplus actually goes
With no bank debt to repay and a business that consumes little fixed capital, PBSA's surplus has three destinations, in order of size: the dividend, the securities portfolio, and — newly, and modestly — a share buyback. The portfolio grew to $19.7M by end-2025, larger than the year's dividend and roughly a third of equity; the Two Profit Engines and Earnings Quality chapters covered its composition and marks. What the capital-allocation lens adds is that the portfolio doubles as a liquidity reserve, not just an earnings line.
The first quarter of FY2026 shows the mechanism. Construction is lumpy in cash as well as in profit: Q1 FY2026 operating cash flow was negative $6.4M, as payments to suppliers ($22.5M) outran collections from customers ($18.8M). To fund the quarter's outflows — including the buyback — the company sold $3.0M of short-term investments, and cash fell from $8.7M to $3.9M [10]. The portfolio is therefore working capital as much as it is a bet: a store of value the company draws down when construction's working-capital cycle swings against it. That is a more benign reading of the $19.7M position than a pure marked-to-model speculation — and a reason the position is unlikely to shrink.
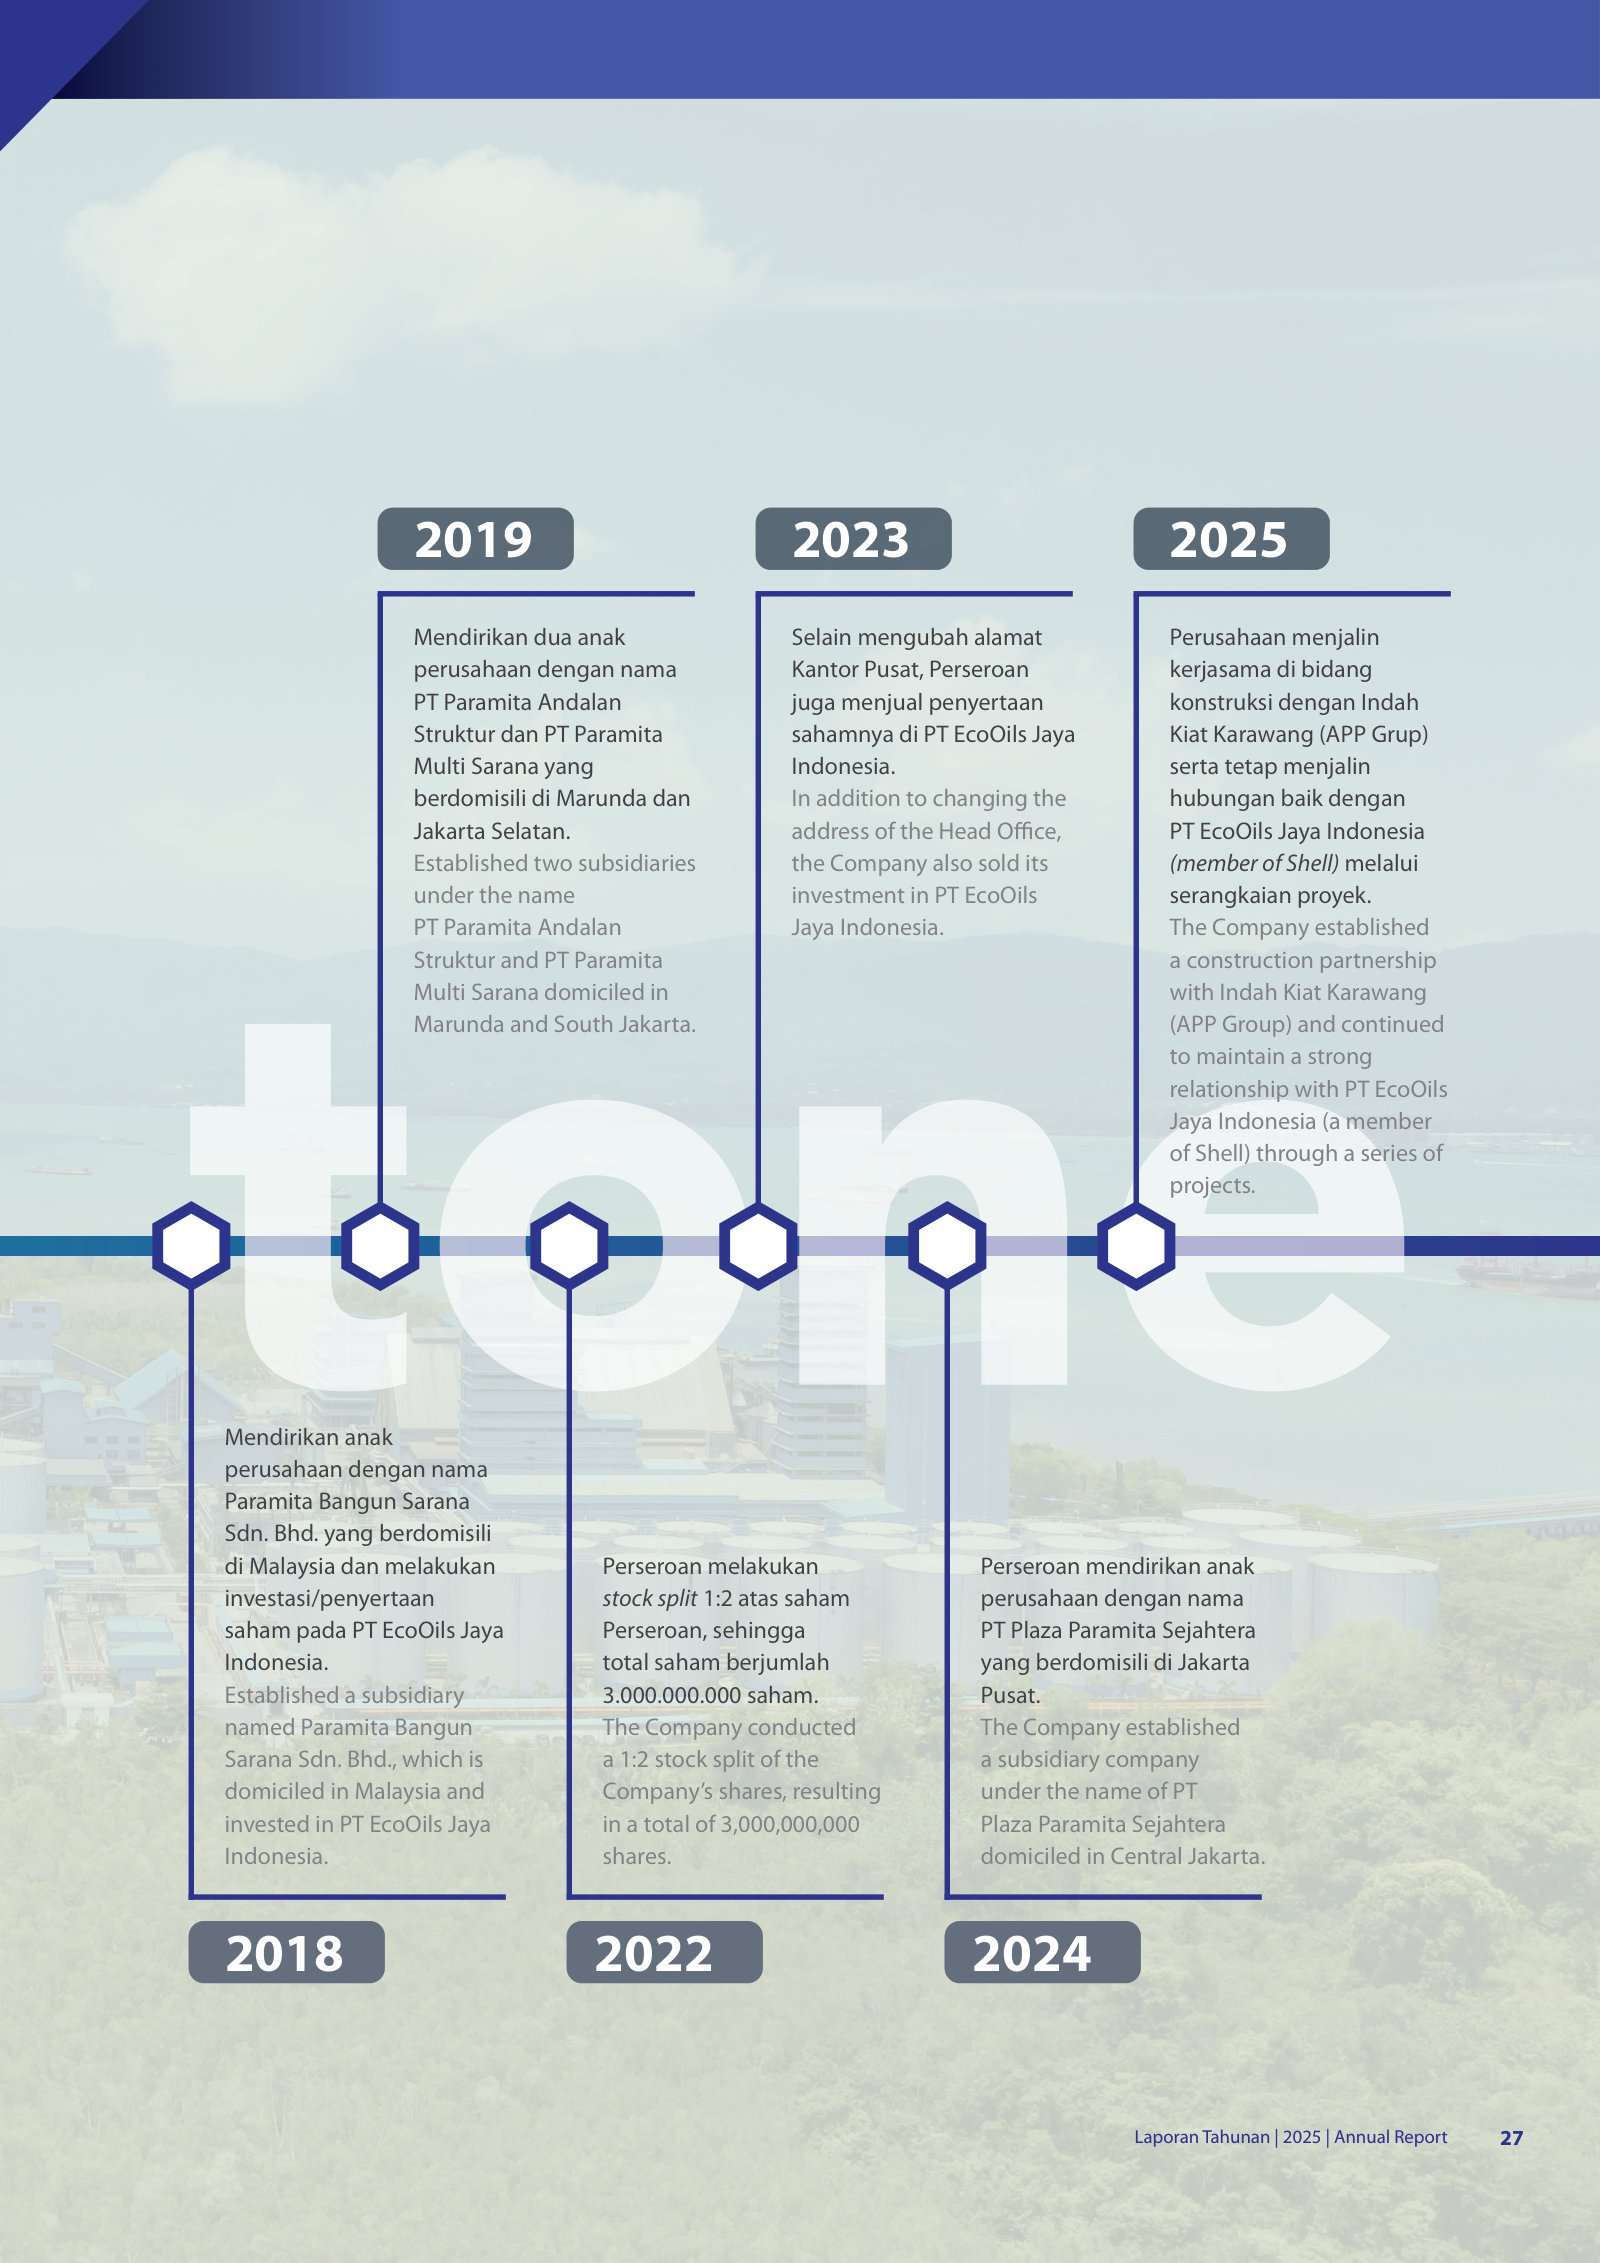
The buyback is the new element. On 2 February 2026 PBSA announced a programme to repurchase up to $6.0M of stock from internal cash [11], and between 3 February and 17 March 2026 it bought 15,113,700 shares [12]. The cash actually spent was $1.16M [13] — under a fifth of the authorised ceiling, at an average of about $0.077 per share, and equal to just 0.5% of the share count. Against a stock that has since fallen to $0.0434, the repurchase is currently underwater; it reads as a small confidence signal after the price collapse rather than a material return of capital.
The share price ran 6x, then the exchange stepped in
None of the capital-return discipline prevented an extraordinary episode in the stock. PBSA traded around $0.022 through the first half of 2025, valuing the company near $66M. It then ran to a Q3 high of $0.069 and a Q4 high of $0.130, closing 2025 at $0.090 for a market capitalisation of $270M [14].
Source: FY2025 Annual Report, Share Performance Highlights [15].
The move had no corporate cause. The company states plainly that in 2025 it undertook no corporate action affecting its capital structure — no split, no bonus issue, no rights offering [16]. The Indonesia Stock Exchange suspended the shares from 11 to 22 September 2025, in its own words "in response to market regulatory dynamics as well as a significant cumulative increase in the Company's share price, as part of a cooling down measure and to protect investors' interests" [17]. The setup is the classic one for a thin-float Indonesian small-cap: with only about 16% of the stock in public hands, modest speculative buying can move the price violently. The unwind has been just as sharp — the shares changed hands at roughly $0.140–$0.146 in late January 2026 and at $0.0434 by 24 July 2026, some 64% below the $0.130 peak. The work of valuing the construction business and the portfolio as separate assets is left to a later chapter; the point here is that the price, not the business, did the round trip.
FY2025 Dividend / Share ($)
FY2025 Payout (reported)
Controllers' Stake
Peak-to-Date Price Fall
Sources: dividend per share and payout [18]; ownership [19]; price fall from $0.130 peak to $0.0434 on 24 July 2026, per share-performance disclosure [20].
Who receives the cash, and who decides
Every dollar of dividend is distributed pro-rata, and the register is dominated by two holding companies. As at 31 March 2026, PT Ascend Bangun Persada owned 46.16% and PT Sigma Mutiara 37.56% — a combined 83.72% — with the public holding the rest and one director, Alexander Sayidiman, registered for 800 shares [21].
Source: Q1 FY2026 Consolidated Financial Statements, Note 21 Share Capital, as at 31 March 2026 [22].
The arithmetic of the payout follows from that register. The FY2023–FY2025 dividends total roughly $31M, of which about $26M flowed to the two controlling holding companies. The high payout, in that light, is the mechanism by which the controllers convert the fortress balance sheet into cash for themselves — legitimately and pro-rata, which also means minority holders are paid alongside them on the same terms. That pro-rata alignment is the reassuring half of the concentration: the controllers take their return the same way outside shareholders do, through the dividend, rather than through related-party dealing. Note that the small buyback was funded from public float — the public stake fell from 16.28% to 15.78% as the treasury shares were absorbed [23] — so the controllers' effective share of the company edged up without their buying a single share.
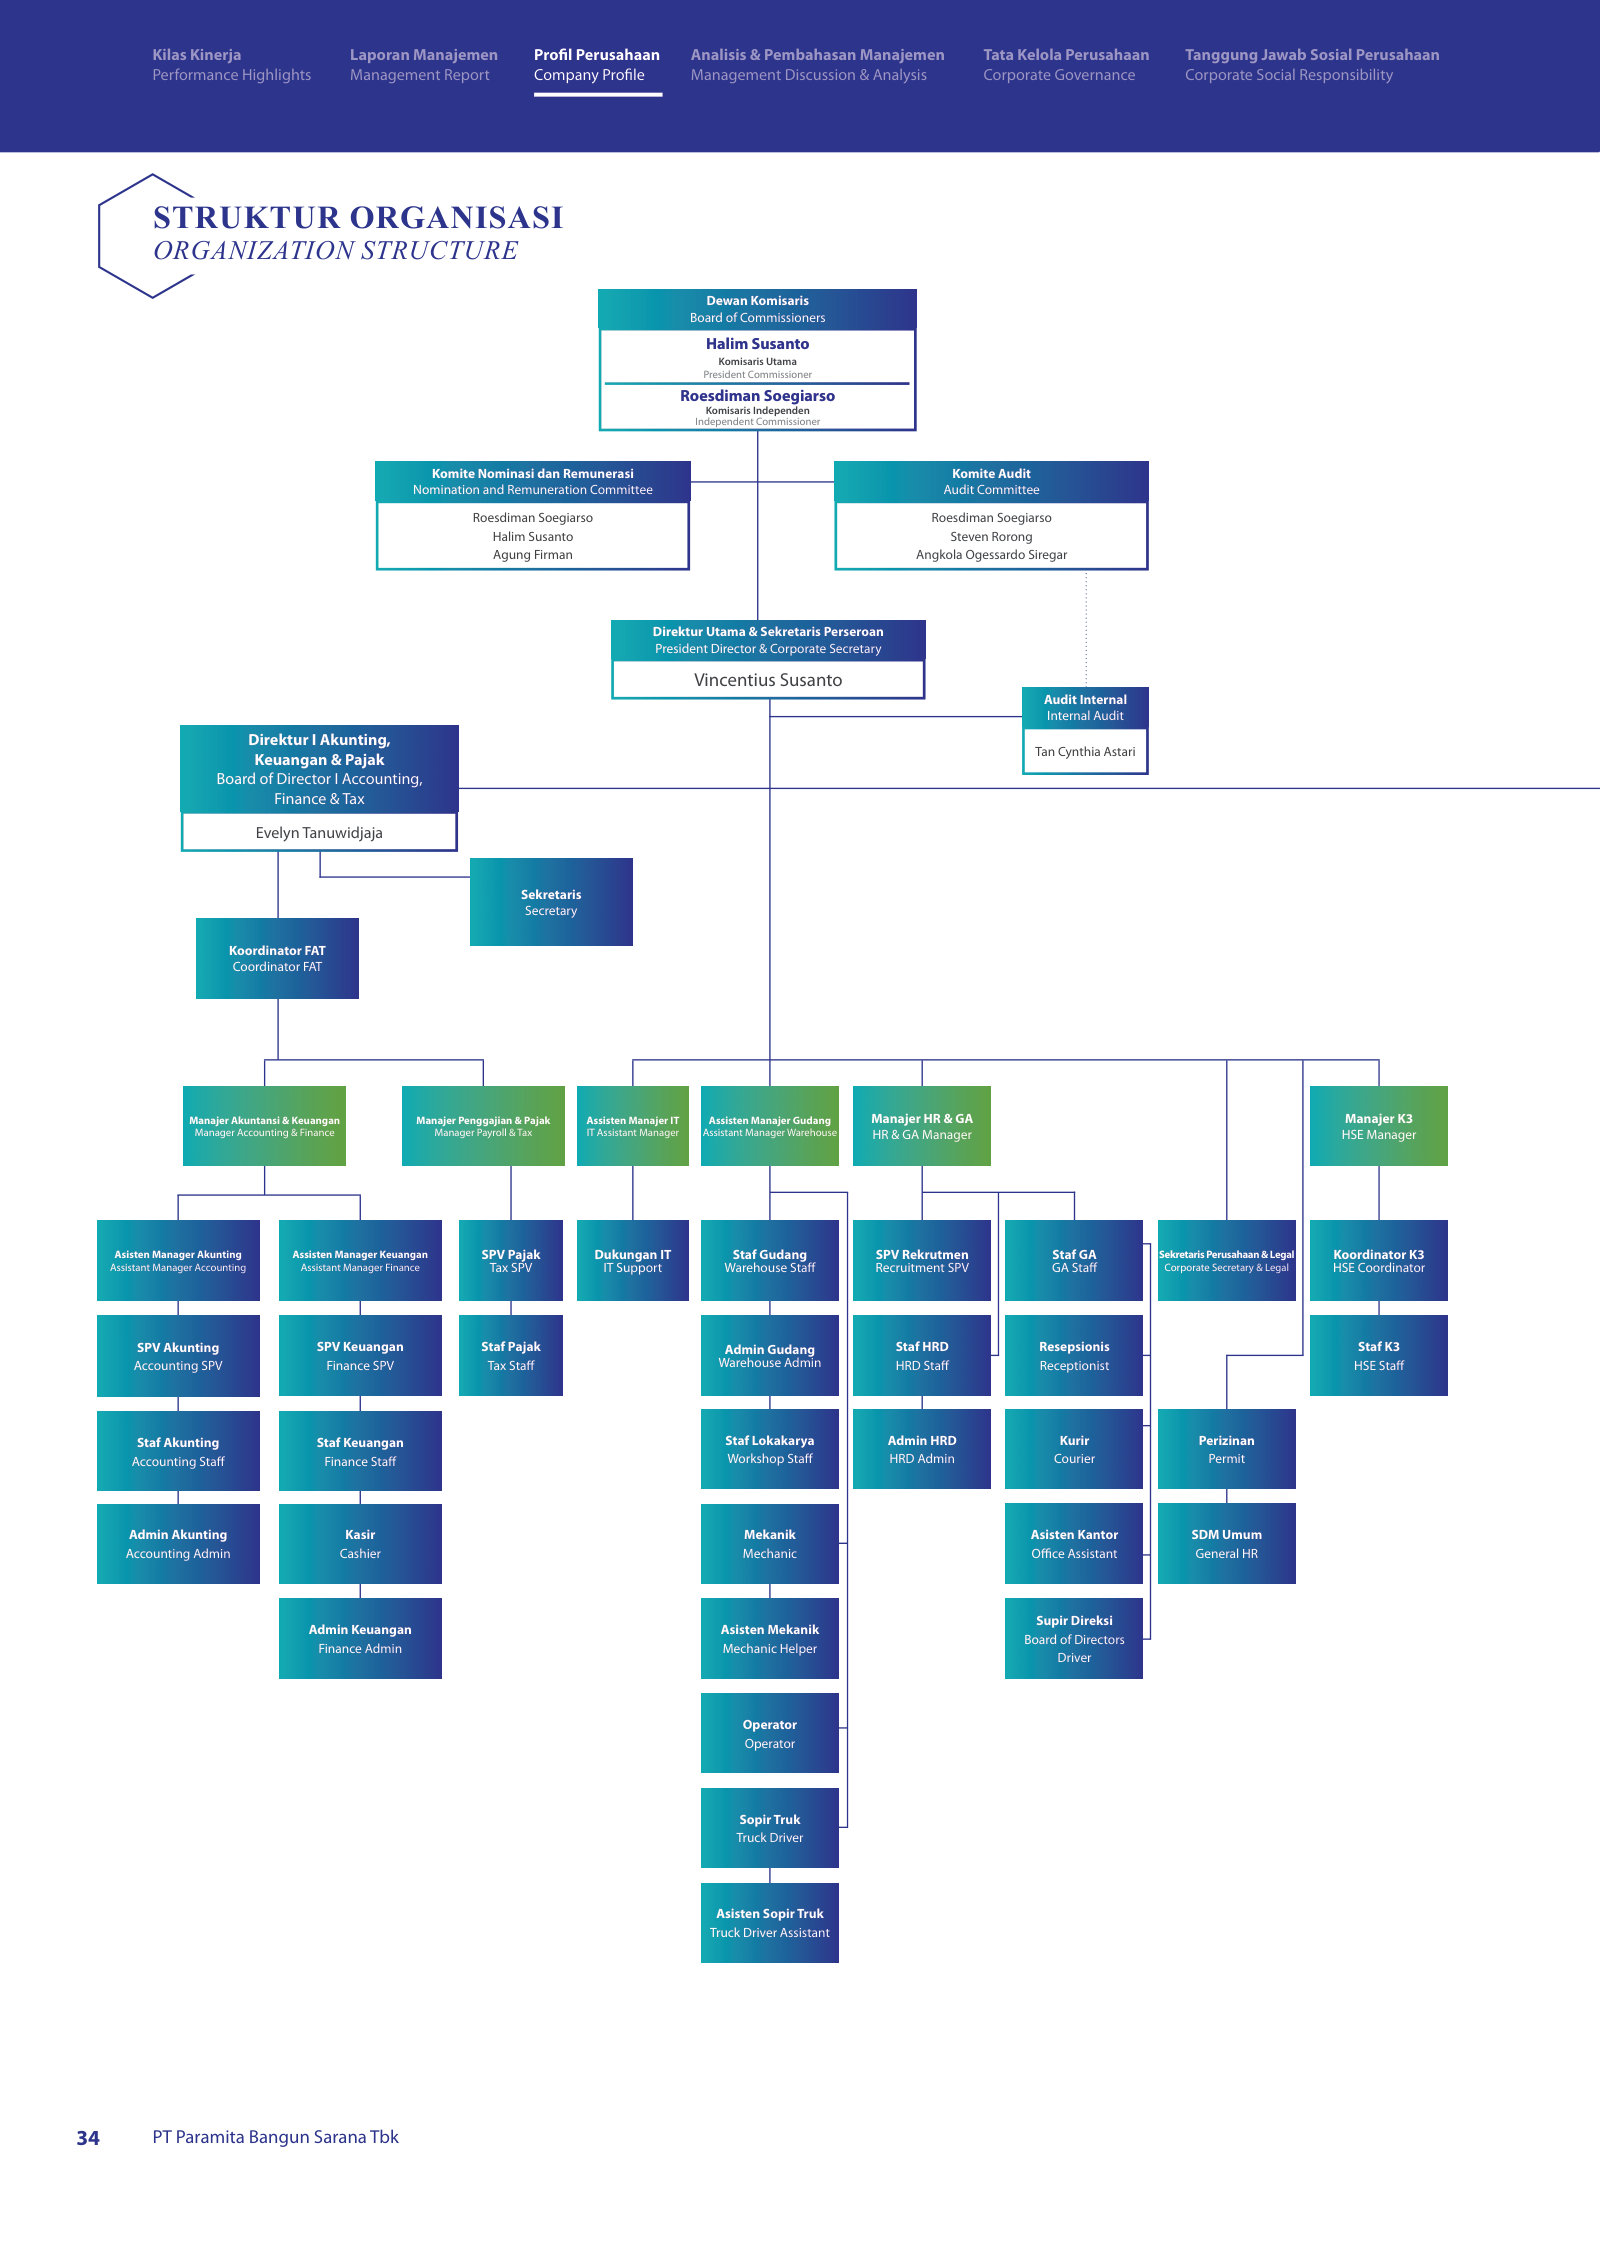
The less reassuring half is the thinness of the outside check. The board has five members under Indonesia's two-tier structure, and only one — Independent Commissioner Roesdiman Soegiarso, who also chairs the Audit Committee — is independent [24]. The President Commissioner (Halim Susanto) and President Director (Vincentius Susanto) share a surname; the Finance Director, Evelyn Tanuwidjaja, is a former executive of Nusadana Capital — the fund group whose vehicles hold 83% of the securities portfolio the Earnings Quality chapter examined. Control of the payout and control of the marks sit with the same small circle, and the executives own almost no stock directly, so their alignment runs through the holding companies rather than personal equity in the listed shares.
Executive pay is not the concern it sometimes is in controlled companies. FY2025 key-management compensation was $0.20M for the directors and $0.046M for the commissioners — about $0.25M combined, or roughly 1.3% of net profit, entirely in cash with no stock or option awards [25]. The controllers extract value through the dividend they mostly receive, not through pay. For a minority investor, the practical read is that governance offers little independent restraint, but the dominant incentive — a large, cash-backed dividend the controllers share pro-rata — points the same way as the outside shareholder's, and there is no disclosed related-party leakage in the pay or the payout. The condition that would change that read is any shift in how the surplus is deployed — a related-party purchase, a larger and more discretionary portfolio, or a payout sized to the marks rather than to construction cash.
Sum-of-the-Parts
Figures converted from IDR at historical FX rates — see data/company.json.fx_rates. Ratios, margins, and multiples are unitless and unchanged.
At US$0.043 (24 July 2026, market capitalisation about $130M), PBSA looks cheap on the headline: 7.3x reported earnings, 2.5x book, a 7.7% dividend yield. But a third of that reported profit is an unrealized securities mark. Once the cash-and-securities stack is valued separately, the market is paying roughly 10x normalized construction earnings — a full multiple for a single-customer contractor — and the securities cushion that flattered the headline P/E has already thinned by about 40% in one quarter.
What the price is
Share Price ($)
Market Cap ($M)
Reported P/E
Price / Book
Dividend Yield
Source: price per IDX daily close 24 Jul 2026; 3,000,000,000 shares and equity $55.8M per FY2025 Annual Report [1]; $0.0036 dividend per FY2025 results [2].
PBSA has 3,000,000,000 shares listed, of which 15,113,700 now sit in treasury after the early-2026 buyback, leaving roughly 2.985bn outstanding [3]. At US$0.043 that is a market capitalisation near $130M. Reported FY2025 net profit was $19.2M and EPS $0.0064, so the trailing multiple is 7.3x — the kind of number that flags a value screen [4]. The $0.0036 per-share dividend declared for FY2025 lifts the yield to 7.7% [5]. On book value, equity of $55.8M puts the stock at 2.5x [6].
The reported P/E is the wrong denominator. FY2025 net profit carried a $6.7M unrealized fair-value gain on the securities portfolio and a $0.34M realized gain; stripping both leaves construction-only net profit of about $12.2M (Earnings Quality) [7]. On that base the whole company trades at 11.5x, not 7.3x.
Source: reported EPS $0.0064 and net profit $19.2M, FY2025 Financial Highlights [8]; normalized construction net $12.2M derived from the FY2025 income statement [9].
Two stacks, not one number
The cleaner way to value PBSA is to separate what it owns from what it does. The company runs with effectively no interest-bearing debt, so its financial assets — cash plus the fair-value securities portfolio — are a stack that can be handed to shareholders or lost to a market move, independent of the construction business. At 31 December 2025 that stack was $28.4M: $8.7M of cash and $19.7M of short-term investments [10]. Subtract that from the $130M market capitalisation and the market is implicitly paying about $111M for the construction operation itself — 9.1x its normalized $12.2M of earnings, or 7.6x its $14.6M of operating income [11].
That was the year-end picture. The most recent balance sheet is worse for the cushion. By 31 March 2026 the cash line had fallen to $3.6M and the securities portfolio to $11.6M — a combined $15.2M, down $11.3M in a single quarter [12]. On the current stack the same arithmetic values the construction business at about $115M, or 10.1x normalized earnings and 8.4x operating income.
Source: market cap at US$0.043 x 3.0bn shares; financial stack = cash plus short-term investments, FY2025 AR [13] and Q1 FY2026 statements [14]; construction stub = market cap less the stack.
The green block is the part of the price a buyer can, in principle, underwrite with a balance sheet. It shrank from a fifth of the market capitalisation to about an eighth in three months, as the quarter's $4.0M portfolio loss and negative operating cash flow drained both cash and marks (Capital and Control). The low headline P/E rested partly on that cushion; the cushion is now materially smaller.
Source: cash and short-term investments, FY2025 AR [15] and Q1 FY2026 statements [16].
The construction-stub multiple
A single-customer contractor with a roughly 12-month backlog does not obviously deserve a full-market multiple, and 10x normalized earnings is not cheap for that risk profile. The case for it rests on two numbers. First, the construction business earns an exceptional return on the capital actually tied up in it: with the $28.4M financial stack removed, operating equity at end-2025 was about $27.4M, and $12.2M of normalized profit on that base is a return above 40% [17]. The business is advance-funded and asset-light; it needs little capital to grow. Second, it is growing quickly: Q1 FY2026 operating income rose 59.8% year on year to $4.6M on revenue up 46.8% [18]. Measured against a forward run-rate rather than trailing FY2025, the same price implies a lower multiple.
Against the peer set, the clean-basis read is the same. PBSA's 7.3x reported P/E, the lowest of the six IDX private-sector contractors, is an artefact of the unrealized investment gains: removing the $7.0M of FY2025 investment income cuts net profit to $12.2M and lifts the normalized whole-company P/E to 11.5x — a 3-4 turn premium to the two comparable net-cash peers (TOTL 8.2x, NRCA 7.3x) — while backing out the $15.2M cash-and-securities stack leaves the market paying ~$115M (~10x normalized earnings, 8.4x operating income) for the construction stub, so on a clean basis PBSA sits at the sector's top book multiple (2.5x, level with TOTL's 2.53x), not at a discount. Those peer multiples are market-aggregator readings as of 24 July 2026, not filing figures; the peer comparison is developed in Peer Multiples.
The evidence points to a construction stub priced for quality and growth rather than for its concentration risk. The strongest fact against that read is that the growth and the returns both depend on one conglomerate's palm-oil downstream capex (Palm Oil Capex): every customer above 10% of revenue and the entire disclosed order book is Sinar Mas / Golden Agri, and the backlog turns over annually with no multi-year visibility. A single lost capex cycle would compress both the earnings base and the multiple at once. What would change the read is order-book replenishment outside that group, or a durable second end-market — neither of which the filings yet show.
The price's own history is the clearest anchor
With no sell-side coverage and no consensus target, the most honest external reference is how the market itself has valued PBSA. Two years ago the stock traded around US$0.023, a market capitalisation near $69M — 5.2x the FY2024 earnings and 1.4x book. In the H2-2025 spike it reached a US$0.090 close ($270M), 14.1x earnings and 4.8x book, before collapsing [19]. Today's 7.3x reported and 2.5x book sits between the two, still roughly 40% above the pre-spike multiple.
Source: closing prices and market capitalisation from Share Performance Highlights, FY2025 AR [20]; earnings and equity per Financial Highlights [21].
The multiple has re-rated even after a 64% fall from the peak. That the price still trades on momentum as much as fundamentals is visible in the tape: it moved from US$0.043 to US$0.046 and back to US$0.043 in the three sessions to 24 July 2026 on no disclosed news. A buyer here is not just paying for the construction business; they are paying a post-spike multiple set by a thin 16% float.
What the range depends on
Because the financial stack is close to a known quantity, the valuation is most sensitive to the multiple placed on the construction stub. Each additional turn of that multiple on $12.2M of normalized earnings is worth about US$0.0038 per share. The table below holds the current $15.2M financial stack fixed and varies the construction multiple.
Source: derived — construction value = $12.2M normalized earnings x multiple; implied price = (construction value + $15.2M financial stack) / 2.985bn shares [22].
At the current US$0.043, the market is placing the construction business at almost exactly 10x. An 8x multiple — still a fair figure for a concentrated contractor — implies about US$0.036, roughly 18% below the price; a growth-premium 12x implies about US$0.051. The second sensitivity is the securities portfolio itself: at $11.6M it is US$0.0039 per share, and Q1 FY2026 showed that number can swing by a third of its value in one quarter [23]. A reader who marks the portfolio conservatively and the construction stub at a concentration discount lands well below US$0.043; one who capitalises the recent construction growth lands above it. The case is most sensitive to which of those two views a reader takes, rather than to the headline 7.3x.
Peer Multiples
Figures converted from Indonesian rupiah at historical FX rates — see data/company.json.fx_rates. Ratios, margins, and multiples are unitless and unchanged.
Indonesia's listed private-sector contractors give PBSA the peer benchmark its own price history could not, and on that benchmark the low headline multiple is the securities cushion's arithmetic, not a discount. PBSA's 7.3x reported P/E, the lowest of the six IDX private-sector contractors, is an artefact of the unrealized investment gains: removing the $7.0M of FY2025 investment income cuts net profit to $12.2M and lifts the normalized whole-company P/E to 11.5x — a 3-4 turn premium to the two comparable net-cash peers (TOTL 8.2x, NRCA 7.3x) — while backing out the $15.2M cash-and-securities stack leaves the market paying ~$115M (~10x normalized earnings, 8.4x operating income) for the construction stub, so on a clean basis PBSA sits at the sector's top book multiple (2.5x, level with TOTL's 2.53x), not at a discount (Sum-of-the-Parts).
At $0.043 the market pays about 10x normalized construction earnings for the stub, and each turn of that construction multiple is worth about $0.0038 per share, so a 6x-to-14x range spans roughly $0.028 to $0.058 (Sum-of-the-Parts). The re-rating case is therefore a debate about the stub multiple, not about a hidden peer discount: on the book-value-and-returns frame the IDX uses to price these contractors, PBSA sits level with the sector's best-quality peer rather than below it. The strongest fact on the other side sits in the same operation: the construction stub earns above 40% on the equity actually tied up in it and grew operating income 59.8% year on year in Q1 FY2026 (Palm Oil Capex), so about 10x may be a fair price for that quality and growth rather than a rich one.
The peer set — general contractors, one market
PBSA has no sell-side coverage, so earlier chapters anchored its valuation to its own two-year multiple history (Sum-of-the-Parts). A live look at the IDX private-sector contractor set supplies the missing outside benchmark. None of the six below was ingested in the corpus, so the figures here are market data as of 24 July 2026 rather than filing citations, and none is a business-model twin: TOTL builds offices, hospitals, malls and hotels; NRCA (a Surya Semesta subsidiary) and JKON build commercial and civil-infrastructure projects; DGIK and IDPR do general construction and foundation work. None depends on a single customer, and none carries a securities book that supplies a third of its reported profit. A seventh name earlier writers flagged, Mitra Pemuda (MTRA), is too small and thinly traded to carry a reliable market multiple. What the set answers is narrower but useful: how the Indonesian market prices contractor equity, and where PBSA sits inside that range.
Sources: PBSA figures from FY2025 Annual Report, Financial Highlights [1] at a price of $0.043; normalized P/E derived by stripping the fair-value marks (see Earnings Quality). Peer figures: market data as of 24 July 2026, per public market aggregators. P/E (normalized) equals reported P/E for all peers, which carry no comparable marks.
Book value is priced off returns
The market's logic across this group is consistent: it pays up for contractors that earn high returns on a net-cash balance sheet, and it discounts those that earn low returns or run on borrowed money. Only two names trade above book value — PBSA at 2.5x and TOTL at 2.53x — and they are the same two names that earn above 30% on equity while holding net cash. The other four earn between 4% and 13% on equity, and every one of them trades below book, from NRCA at 0.91x down to JKON at 0.34x. The two net-debt names, DGIK and IDPR, sit at the bottom of the returns range and carry the highest and least reliable earnings multiples.
Source: PBSA ROE derived from FY2025 reported profit and year-end equity [2]; peer ROE and P/B from market data as of 24 July 2026.
The relationship is close to a straight line, and it places PBSA and TOTL together at the top-right corner — the high-return, high-multiple corner — while the rest cluster below book at single-digit or low-teens returns.
Source: PBSA P/B at $0.043 against FY2025 equity of $55.75M [3]; peer P/B from market data as of 24 July 2026.
There is a caveat on PBSA's own place on that line. Its 34% headline return on equity is itself lifted by the fair-value marks: the $6.69M gain that ran through FY2025 profit [4] is part of the numerator. Stripping it leaves normalized profit of about $12.17M on $55.75M of equity closer to 22%. The construction operation earns well above 40% on the roughly $27.4M of equity actually tied up in it (Sum-of-the-Parts); the group return is diluted by the large idle cash-and-securities stack the rest of the balance sheet carries. TOTL's 33% return, by contrast, is construction all the way through.
The Total Bangun Persada mirror
TOTL is the closest thing PBSA has to a live comparable, and the resemblance is unusually tight: 2.53x book against PBSA's 2.50x, a 32.8% return on equity against 34.4%, a net-cash balance sheet against net cash, and a 7.0% dividend yield against 7.7%. The market has handed the two contractors almost exactly the same book multiple. What differs is what sits underneath it. TOTL's revenue is spread across offices, hospitals, shopping centres and hotels for many private clients; PBSA's entire order book is construction work for one palm-oil group (Palm Oil Capex). And TOTL's earnings are construction earnings, where roughly a third of PBSA's reported profit is the unrealized fund marks [5]. PBSA is paying the same price as its highest-quality peer while carrying two risks that peer does not.
What the low P/E hides
The 7.3x reported P/E is the number that makes PBSA screen cheap, and among peers it looks ordinary — NRCA is on 7.3x, JKON on 7.9x, TOTL on 8.2x. But PBSA's reported earnings include the marks, and the peers' do not. On normalized construction earnings of about $12.17M the multiple is 11.5x, not 7.3x. On that basis PBSA is the second-most-expensive name in the group on earnings, behind only the two names — DGIK at 12.5x and IDPR at 20.1x — whose low multiples-of-nothing reflect depressed earnings and net debt rather than quality. Against the two profitable net-cash peers it most resembles operationally, TOTL (8.2x) and NRCA (7.3x), the marks-adjusted PBSA trades at a premium of three to four turns.
Discount or premium
On the evidence here, PBSA is not hiding a peer discount. The IDX prices these contractors principally off book value and returns, and on that axis PBSA is priced in the premium tier, level with the sector's best-quality name, without a haircut for its single-customer concentration or for the share of profit that comes from marks rather than construction. The strongest fact on the other side is that PBSA's construction operation earns a higher return on the capital actually deployed in it — above 40% on operating equity, with operating income up 59.8% year on year in Q1 FY2026 (Sum-of-the-Parts) — than TOTL earns on its whole book, so if the cash-and-securities stack is valued separately, a 2.5x multiple on the operating equity alone is arguably fair for that return rather than rich. What would settle the read is a sustained order book won outside the Sinar Mas and Golden Agri group, which would close the concentration gap that separates PBSA from an otherwise-identical TOTL — or the reverse, a de-rating of TOTL toward the sub-book levels of the rest of the group, which would leave PBSA's premium exposed.
What to Watch
Figures converted from Indonesian rupiah at historical FX rates — see data/company.json.fx_rates for the rate table. Ratios, margins, and multiples are unitless and unchanged.
The earlier chapters set out the case; this chapter does not re-argue it. It sets the two profit engines side by side on the facts both a bull and a bear accept, and turns those facts into a short list of line items — each with the filing it appears in and the number that would change the read. On today's evidence the case does not resolve; it resolves on a handful of checkable disclosures over the next few filings.
Where the bull and the bear agree, and split
The disagreement about PBSA is not about the facts. Both sides accept the same numbers: construction operating income of $14.6M in FY2025, growing 59.8% year-on-year in the first quarter of FY2026 [1][2]; a $6.7M unrealized fair-value gain that supplied 31% of FY2025 pretax profit and then reversed into a $4.3M loss in Q1 FY2026 [3][4]; a securities book carried 83% in Nusadana-branded funds and 99.7% at manager net asset value [5]; and an 83.7% control block that takes its return through a dividend sized to construction earnings, not the headline (Capital and Control). What separates the two readings is what each fact is taken to mean.
Sources: operating income and fair-value gain, FY2025 Annual Report, Statement of Profit or Loss [6] and Q1 FY2026 statements [7]; portfolio composition, Note 11 [8]; ownership, Q1 FY2026 Note 21 [9].
The bull case has the stronger through-quarter evidence. In Q1 FY2026 PBSA's construction-driven operating income grew 59.8% to $4.9M, yet net profit fell 94% to $0.09M because the investment portfolio swung to an unrealized fair-value loss of $4.3M [10]; FY2025 operating cash flow of $22.0M came entirely from construction collections (Earnings Quality) [11]; and the board's own dividend, at roughly 89% of normalized construction profit but only 56% of the headline, shows management valuing the same distinction (Capital and Control) [12]. The bear case has the stronger structural evidence: every customer above 10% of revenue and the entire disclosed order book is one palm-oil group [13][14], and the marks that flatter the headline are self-certified by a manager three insiders once ran (Family and Funds) [15].
The most time-sensitive item is the cushion
One shared fact moves faster than the rest. The cash-and-securities stack that made the 7.3x headline P/E look cheap fell from $28.4M at the end of 2025 to $16.3M three months later — a 42% drop in a single quarter, as the portfolio was marked down $4.3M and $3.0M of units were sold to bridge a negative operating quarter (Sum-of-the-Parts).
Source: cash and short-term investments, FY2025 Annual Report balance sheet [16] and Q1 FY2026 balance sheet [17].
Part of the drop is deliberate — $3.0M sold as working capital, $1.2M spent on the buyback [18] — and part is the mark reversing. Both readings point to the same watch item: whether the stack stabilizes over the coming quarters or keeps draining. If it drains, the low headline multiple loses the asset backing that justified it; if it holds, the bull's "monetizable reserve" reading is confirmed.
What would decide it
The reconciliation converges on line items a reader can check without a view on palm-oil prices or fund NAVs. Each is falsifiable: it names where the disclosure lives and the number that flips the read.
Sources: customer and order-book concentration, FY2025 Note 26 [19] and FY2024 Note 34 [20]; portfolio and fair-value line, Note 11 [21]; operating cash flow, Q1 FY2026 statements [22]; float, Q1 FY2026 Note 21 [23]; related parties, Note 30 [24].
Two of these are largely inside the reader's reach today and two are not. The board is independent in name on one seat of five, and the current ownership of the Nusadana manager is a registry fact the filings do not carry and this run could not retrieve [25] — so the related-party question stays open, a governance flag rather than a proven finding. Peer benchmarking against the IDX private-contractor set would sharpen the multiple read, but no peer filings were ingested this run. Those gaps are named here so the next reader knows where the checkable evidence ends.
Two paths
The watch-list is what separates two coherent futures, and the same price fits either.
On the first path, construction keeps compounding, the order book replenishes — even within the Sinar Mas orbit — and the marks stay the sideshow the board already treats them as. That leaves a debt-free contractor earning above 40% on its operating equity, priced near 10x normalized construction earnings with a 7–8% dividend yield (Sum-of-the-Parts) [26], and a securities book that behaves as a monetizable reserve rather than a liability. On the second, the palm-oil capex cycle turns, the roughly 12-month backlog thins, and the marks keep reversing without ever clearing in cash — in which case the same $0.043 is a full multiple for a single-customer contractor plus a self-certified portfolio, and the low headline P/E reflected the size of the cash cushion rather than a discount, a cushion already 42% smaller than a quarter earlier.
The evidence points to the first path being the base case and the second the live risk. The construction engine is genuine, cash-generative, and treated by management as the real business; its largest threat is not the marks, which are visibly walled off from the dividend, but the concentration beneath the construction line — one conglomerate, one commodity, one short backlog. Among the facts that would most strengthen the bull read is a contract won outside the Sinar Mas / Golden Agri ecosystem; among those that would most damage it is a construction down-cycle that forces the dividend to lean on selling the Nusadana stack, whose up-marks have never yet been tested by a cash redemption. Whether the record FY2024-25 profit was a durable franchise or a flattered contractor is decided on those lines, not on this year's headline.